
Figures & data
Figure 1. Flow diagram of literature selecting based on the inclusion and exclusion criteria. The left and right parts of the flow diagram represent the retrieval and screening process of TNF-α and CRP respectively. There are several articles that provided both comparison data between OSA and controls and between different treatments in OSA participants, or even one paper covered both TNF-α and CRP, thus the total count of included papers were less than the direct sum of each part.
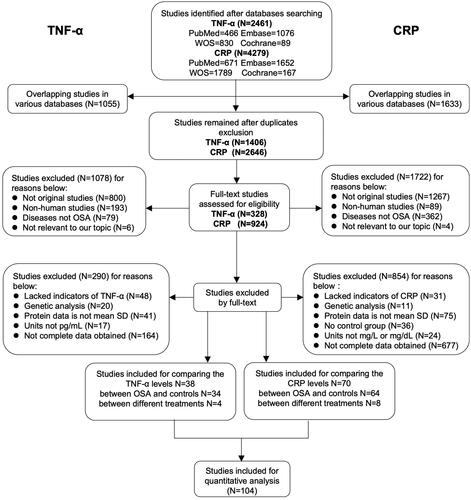
Figure 2. Inflammation proteins of TNF-α and CRP were associated with severity of OSA. Weighted mean difference (WMD) and 95% confidence interval (95%CI) for inflammation proteins levels of TNF-α (A), CRP (B) were compared between mild, moderate, severe OSA patients and controls respectively. NO. of articles: number of articles included for analysis in each group. NO. of P/C: number of OSA patients (P) and controls (C) were included for each group. The statistically different results with p<.05 were shown in blue point.
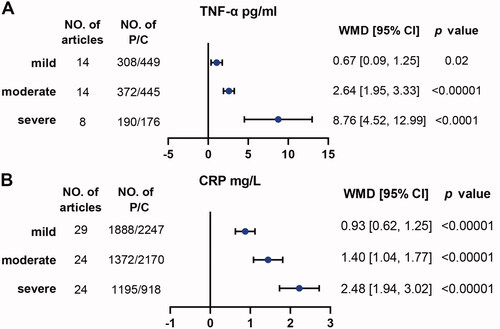
Table 1. Summary of studies included in analysis of TNF-α levels between OSA and controls.
Table 2. Summary of studies included in analysis of CRP levels between OSA and controls.
Table 3. Characteristics of TNF-α and CRP levels in OSA participants with interventions of CPAP and non-CPAP.
Table 4. Comparison of TNF-α and CRP levels with different interventions in OSA subjects.
Figure 3. The design of Mendelian Randomization (MR) analysis to assess causality between OSA and inflammation proteins. (A) SNPs independently associated with OSA from GWAS summary statistic were used as instrumental variables to explore the causal effect of OSA on CRP or TNF-α. (B) SNPs independently associated with CRP or TNF-α from GWAS summary statistic were used as instrumental variables to explore the causal effect of CRP or TNF-α on OSA respectively. In addition to the association assumption, another two assumptions of MR include (1) SNPs are not associated with confounders between exposure and outcome, and (2) the effect from SNPs to outcome was exclusively through exposure.
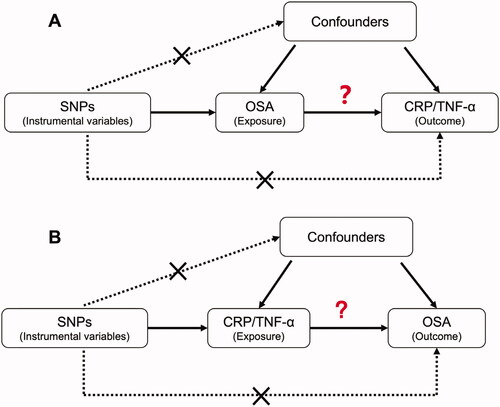
Figure 4. Causality analysis for OSA on CRP or TNF-α by Mendelian Randomisation (MR). Several MR methods were used to analyse the causality for OSA as exposure, CRP (A) and TNF-α (B) as outcomes respectively. If heterogeneity existed, outliers were removed and following similar analysis again. IV: instrumental variable. SNP: single nucleotide polymorphism. IVW: inverse variance weighted. MR RAPS: MR-Robust Adjusted Profile Score (RAPS). The statistically different results with p<.05 were shown in blue point otherwise were shown in black point if p >.05.
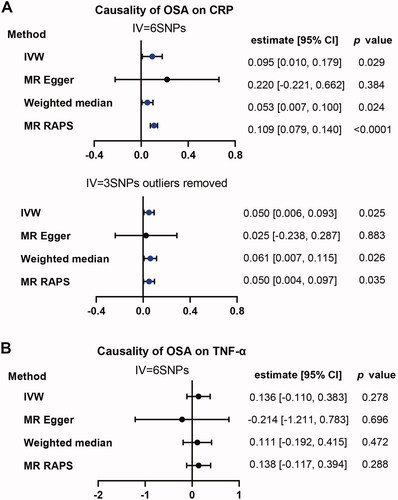
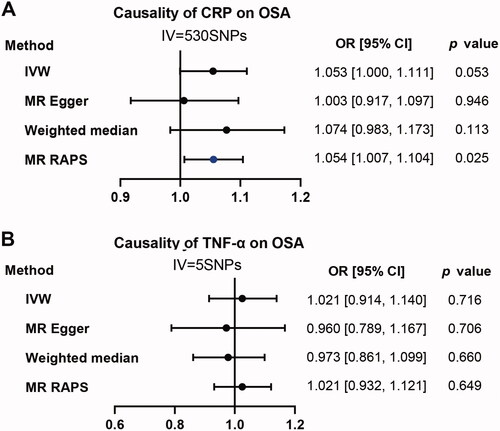
Figure 5. Causality analysis for CRP and TNF-α on OSA by Mendelian Randomization (MR). Several MR methods were applied to test the causality for CRP (A) and TNF-α (B) as exposure individually, OSA as outcome. IV: instrumental variable. SNP: single nucleotide polymorphism. IVW: inverse variance weighted. MR RAPS: MR-Robust Adjusted Profile Score (RAPS). The statistically different results with p<.05 were shown in blue point otherwise were shown in black point if p >.05.
Supplemental Material
Download Zip (3.6 MB)Data availability statement
Data is available on request to the corresponding author.