
Figures & data
Figure 1. Diagram of the ETDRS chart. The retinal sensitivity test results of microperimetry are automatically matched with the fundus photos. (A) Right eye; (B) Left eye.
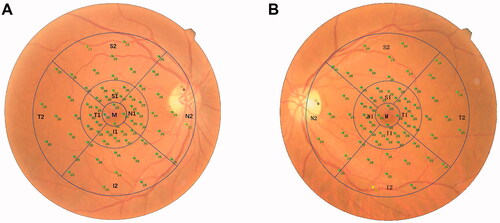
Figure 2. OCTA scans. (A) The superficial capillary plexus; (B) deep capillary plexus; (C) radial peripapillary capillary plexus.
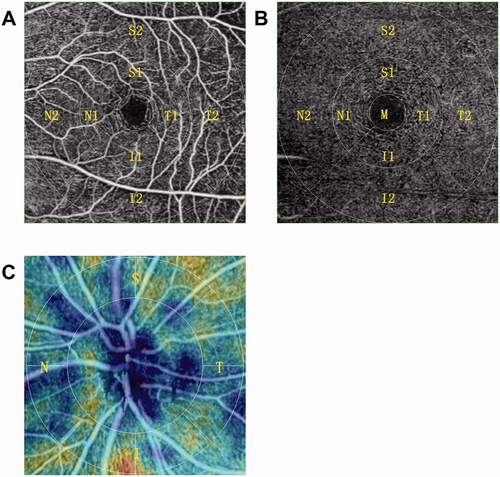
Table 1. Characteristics of the participants.
Table 2. Microperimetric retinal sensitivity (dB).
Table 3. Microvascular changes, VD and PD of RPCP, SCP, and DCP, and FAZ area, perimeter, and circularity.
Table 4. Correlation of retinal volume, retinal thickness, and VD and PD of SCP and VD and PD of DCP in the NDR group.
Supplemental Material
Download MS Word (22.2 KB)Data availability statement
The datasets used and/or analysed during the current study are available from the corresponding author on reasonable request.