
Figures & data
Figure 1. The flowchart of network pharmacology analysis of the mechanisms of JFFZLZ acting on UC.
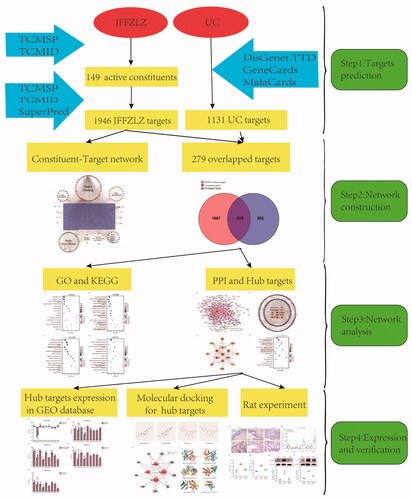
Figure 2. The interaction network between JFFZLZ targets and UC targets. (A) The constituent − target network. The blue rectangle means target; five circles, a pink square and a yellow vertical line mean constituent of JFFZLZ. Besides, the other’s letters mean repetitive ingredients. Meanwhile, A1, A2, B1, B2, C1, D1, E1, F1, G1, and H1 represents stigmasterol, folinic acid, quercetin, isoquercitrin, beta-sitosterol, daucosterol, deltoin, heptadecane, tridecanoic acid, and kaempferol respectively. (B) The OGEs between the JFFZLZ targets and UC targets.
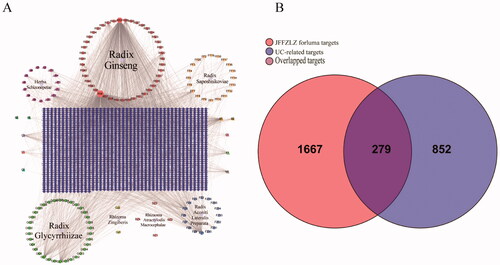
Figure 3. Enrichment analysis for the OGEs. (A) The 15 most enriched CC (p ≤ 0.01). (B) The 15 most enriched BP (p ≤ 0.01). (C) The 15 most enriched MF (p ≤ 0.01). (D) The 15 most enriched KEGG pathways (p ≤ 0.01).
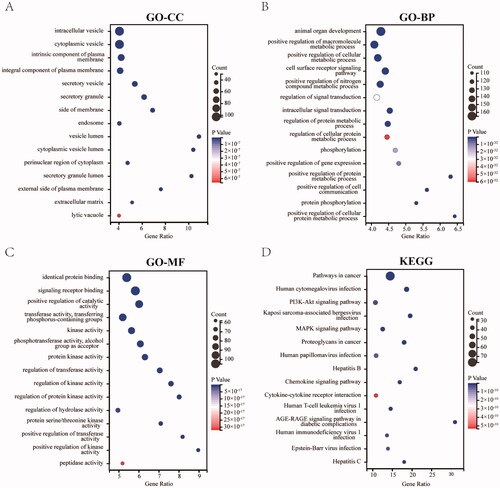
Figure 4. Construction of PPI network between JFFZLZ and UC, and screening of hub targets. (A) The PPI network between JFFZLZ and UC. Each node represents a protein and the connections represent the interaction between two proteins. A thicker connection represents a higher correlation. A bigger node means more important targets. (B) Hub targets. The central triangle means hub target. Colour depth means centricity in the network, the others refer to the remaining target of PPI. (C) The PPI network in hub targets. (D) KEGG enrichment analysis of the nine hub targets.
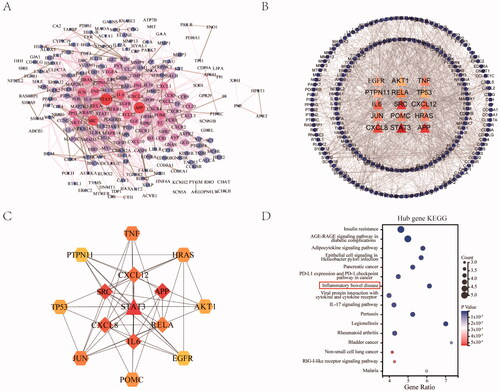
Figure 5. KEGG enrichment and molecular docking analysis for the core hub targets. (A) The 2D structure of the key constituents. (B) Interaction network between the key constituents and hub targets. The light red rounds represent active constituents of prediction, the purple hexagons represent hub targets. The size of the icon was set according to the degree of the network. (C) The 3D molecular docking structures of key compounds and key target genes.
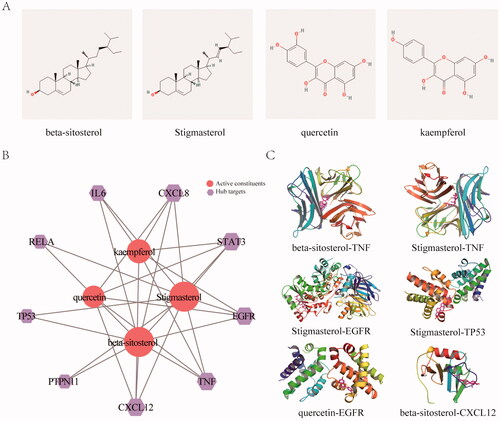
Table 1. Common constituent in JFFZLZ.
Table 2. The docking scores of key constituents and hub targets.
Figure 6. Expression of core hub targets in UC patients. (A-E) The core hub genes’s mRNA expression in normal and UC colon tissues in GEO datasets. Differences in means are considered statistically significant at p < 0.05. Significance levels are *p < 0.05, **p < 0.01, ***p < 0.001, and ns: not significant.
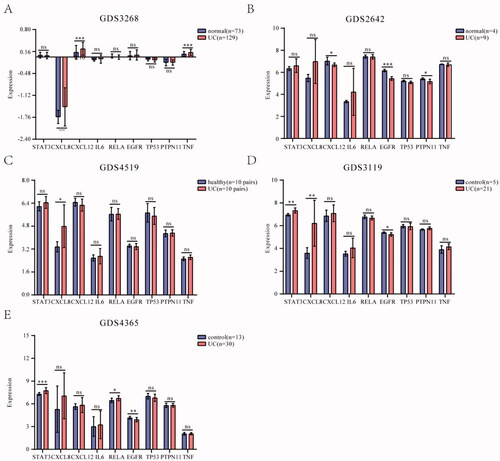
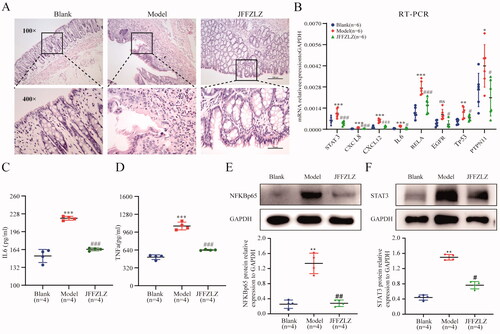
Figure 7. JFFZLZ released the UC rats’ inflammatory response and regulated the hub targets. (A) HE staining for rat colonic tissues. (B) The mRNA expression of the hub targets in rat colonic tissues, detected by RT-PCR and GAPDH as internal control gene. (C-D) The protein expression of IL6 (C) and TNFα (D) in rat colonic tissues, detected by ELISA. (E-F) The protein expression of NFKBp65 (E) and STAT3 (F), detected by WB, and GAPDH as internal control protein. Differences in means are considered statistically significant at p < 0.05. Compare to the Blank group, *p < 0.05, **p < 0.01, ***p < 0.001, and ***p < 0.0001. Compare to Model group, #p < 0.05, ##p < 0.01, and ###p < 0.001.
Supplemental Material
Download PDF (428.9 KB)Supplemental Material
Download MS Excel (10.6 KB)Supplemental Material
Download MS Excel (60 KB)Supplemental Material
Download MS Excel (15.4 KB)Supplemental Material
Download MS Excel (9.9 KB)Data availability statement
All the relevant data is provided within the paper and its supporting information files. The datasets analysed during the current study are available from the corresponding author on reasonable request. This work described was original research that has not been published previously and is not under consideration for publication elsewhere, in whole or in part.