
Figures & data
Table 1. General and clinical characteristic of the epilepsy cohort.
Table 2. Description of SCN genes variants among epilepsy cases and healthy controls.
Figure 1. Linkage disequilibrium (LD) plots of variants within SCN2A. Values in the boxes from top to bottom are D, D′, r and p value. Boxes without numbers have D′= 1. Red boxes indicate a significant, whereas yellow boxes indicate insignificant variants.
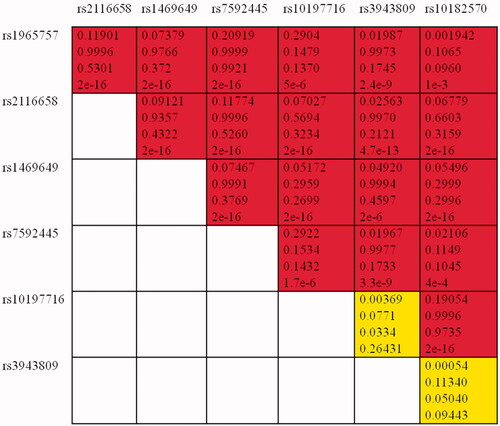
Table 3. Genetic association between the SCN polymorphisms and epilepsy.
Table 4. Regression analysis of SCN variants and epilepsy features.
Table 5. Regression analysis of SCN variants and epilepsy features.
Data availability statement
The data used to support the findings of this study are available from the corresponding author upon reasonable request.