
Figures & data
Figure 1. Urinary exosomes identification. (A) TEM image of exosomes from healthy controls and CKD patients. (B) NTA analysis of urinary exosomes. (C) Western blot showed that exosomes from healthy controls and CKD patients expressed CD9 and TSG101.
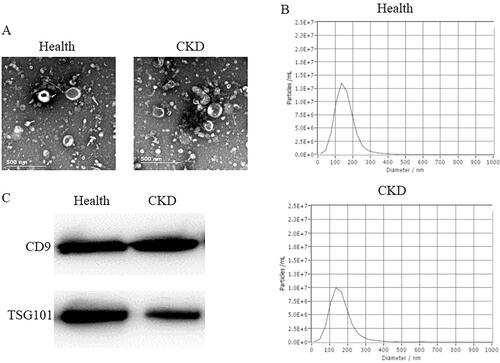
Figure 2. Human circRNAs microarray. (A) Volcano map of circRNAs microarray. (B) Heat map of circRNAs microarray.
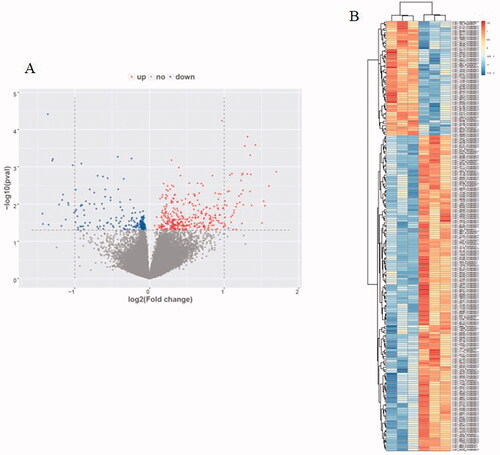
Table 1. Clinical profile of patients with CKD and healthy controls.
Figure 3. Expression of hsa_circ_0036649 in urine exosomes from CKD patients and healthy control. (A) Expression of hsa_circ_0036649 was significantly decreased in CKD patients compared to healthy controls. (B) In CKD patients, urinary exosomes hsa_circ_0036649 expression was significantly decreased in mild-moderate and severe renal fibrosis patients compared to none fibrosis (#p < .001 vs control; *p = .012 vs none fibrosis; **p = .041 vs mild-moderate, p < .001 vs none fibrosis).
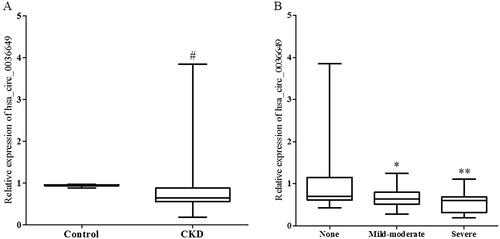
Table 2. Clinical and pathological parameters of CKD patients.
Figure 4. Correlation between hsa_circ_0036649 expression and clinical parameters. (A) Spearman correlation between hsa_circ_0036649 and Scr (rs = −0.366, p < .001). (B) Spearman correlation between hsa_circ_0036649 and BUN (rs = −0.215, p = .006). (C) Spearman correlation between hsa_circ_0036649 and cystatin c (rs = −0.424, p < .001). (D) Spearman correlation between hsa_circ_0036649 and eGFR (rs = 0.374, p < .001).
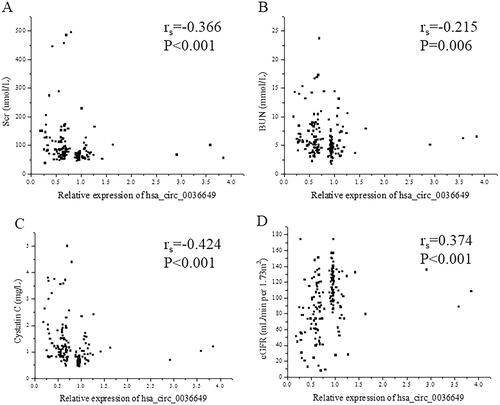
Figure 5. Correlation between hsa_circ_0036649 expression and 24 h Proteinuria, renal fibrosis pathological parameters. (A) Spearman correlation between hsa_circ_0036649 and 24 h Proteinuria (rs = −0.214, p = .024). (B) Spearman correlation between hsa_circ_0036649 and score of TIF (rs = −0.360, p < .001). (C) Spearman correlation between hsa_circ_0036649 and score of glomerular sclerosis (rs = −0.273, p = .004).
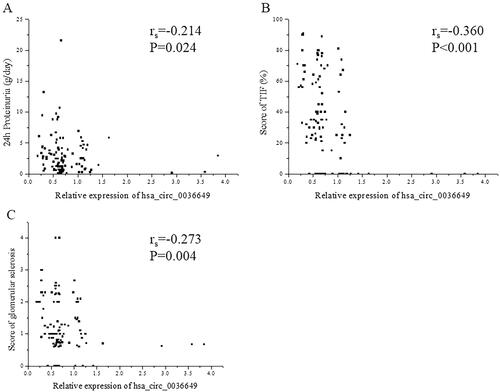
Table 3. Multivariate logistic regression analysis of selected variables for renal fibrosis.
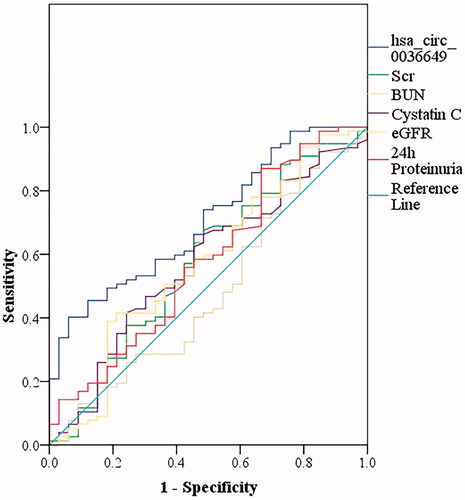
Figure 6. The receiver operating characteristic (ROC) curve showed the diagnosis value of the urine exosomes hsa_circ_0036649 for renal fibrosis. ROC curve showed the urine exosomes hsa_circ_0036649 distinguished renal fibrosis (AUC of 0.706, 95% CI, 0.606–0.807; p = .001).
Supplemental Material
Download Zip (669.4 KB)Data availability statement
The datasets used and/or analysed during the current study are available from the corresponding author on reasonable request.