
Figures & data
Figure 1. Structure of network formed by interventions. The lines between treatment nodes indicate the direct comparisons made within randomized controlled trials. (A) IBL. (B) PBL. (C) HBC. (D) TRF. (E) VTE. IBL: intraoperative blood loss; PBL: postoperative blood loss; HBC: change in haemoglobin during the 24-h postoperative period; TRF: perioperative blood transfusion rate; VTE: venous thrombosis.
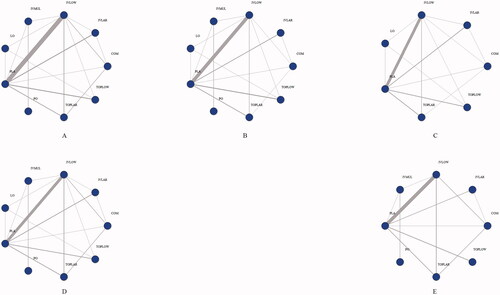
Figure 2. Forest plots. (A) IBL. (B) PBL. (C) HBC. (D) TRF. (E) VTE. (The results of TRF and VTE are expressed as the natural logarithm of risk ratio. Differences between treatments were considered significant when the 95% CI did not contain 0 for lnRRs and MDs). RR: risk ratio; MD: weighted mean difference; IBL: intraoperative blood loss; PBL: postoperative blood loss; HBC: change in haemoglobin during the 24-h postoperative period; TRF: perioperative blood transfusion rate; VTE: venous thrombosis.
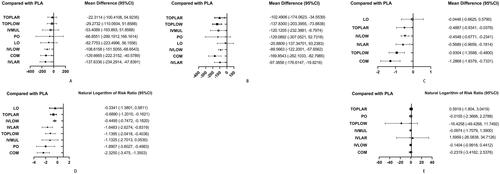
Figure 3. Cluster-rank plots. (A) The cluster-rank plot of IBL and VTE. (B) The cluster-rank plot of TRF and VTE. (The cluster-rank value is the product of the abscissa and ordinate of each treatment). IBL: intraoperative blood loss; TRF: perioperative blood transfusion rate; VTE: venous thrombosis.
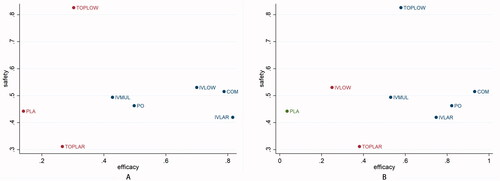
Table 1. Detailed results of main analysis.
Table 2. The league plots of efficacy endpoints.
Table 3. The league plots of safety endpoint. VTE (Red. (From the top left to the bottom right, higher comparator vs. lower comparator, natural logarithm of RR with 95% CI.).
Supplemental Material
Download PDF (1,019 KB)Data availability statement
The data that support the findings of this study are available from the corresponding author upon reasonable request.