Figures & data
Figure 1. A schematic flow for the selection of articles included in this meta-analysis.
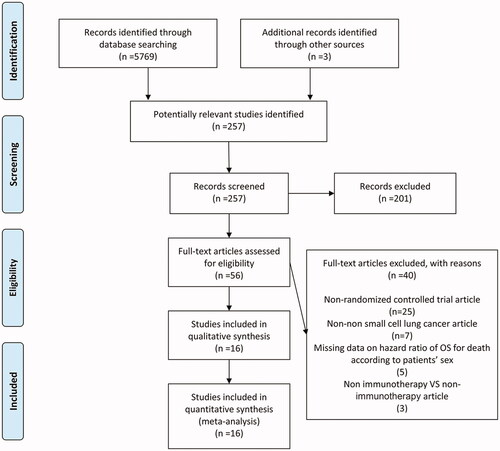
Table 1. Characteristics of included clinical trials in the meta-analysis.
Figure 2. Forest plot of comparison: overall survival of patients receiving ICIs alone or with chemotherapy versus patients not receiving ICIs (receiving chemotherapy or placebo only) (male: p < .001, female: p < .001, overall: p < .001).
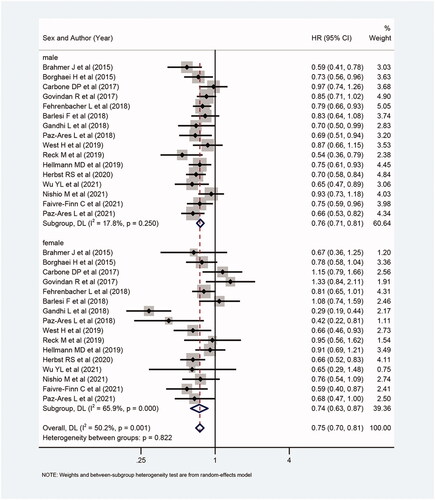
Figure 3. Forest plot of comparison based on whether the intervention group contains chemotherapy. (a) Overall survival of patients receiving ICIs plus chemotherapy versus patients receiving chemotherapy alone (male: p < .001, female: p = .018, overall: p < .001). (b) Overall survival of patients receiving ICIs versus patients receiving chemotherapy alone (male: p < .001, female: p = .005, overall: p < .001).
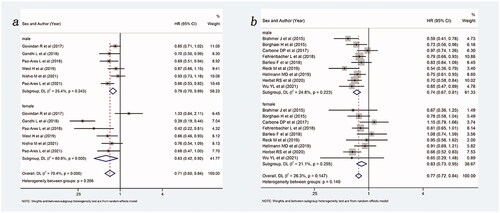
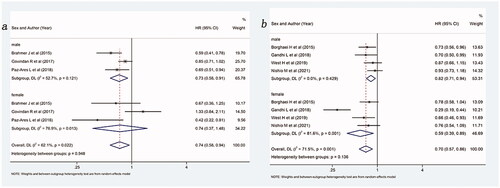
Figure 4. Forest plot of comparison based on treatment stage. (a) Overall survival of patients receiving ICIs with or without chemotherapy versus patients not receiving ICIs (receiving chemotherapy or placebo only) in first line (male: p < .001, female: p = .023, overall: p < .001). (b) Overall survival of patients receiving ICIs with or without chemotherapy versus patients not receiving ICIs (receiving chemotherapy or placebo only) in non-first line (male: p < .001, female: p < .001, overall: p < .001).
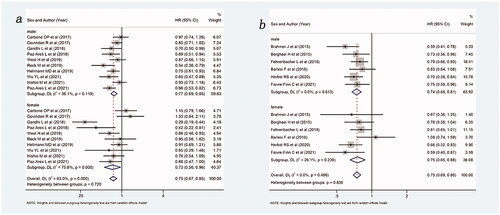
Figure 5. Forest plot of comparison based on the type of ICIs. (a) Overall survival of patients receiving PD-1 inhibitor with or without chemotherapy versus patients not receiving ICIs (receiving chemotherapy or placebo only) (male: p < .001, female: p = .006, overall: p < .001). (b) Overall survival of patients receiving PD-L1 inhibitor with or without chemotherapy versus patients not receiving ICIs (receiving chemotherapy or placebo only) (male: p < .001, female: p = .003, overall: p < .001).
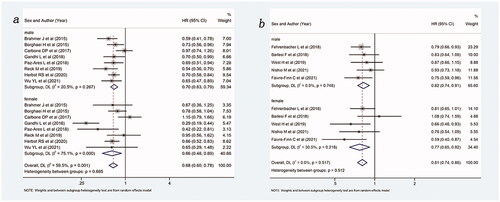
Figure 6. Forest plot of comparison based on histological type. (a) Overall survival of patients receiving ICIs with or without chemotherapy versus patients not receiving ICIs (receiving chemotherapy or placebo only) in squamous NSCLC (male: p = .005, female: p = .400, overall: p = .015). (b) Overall survival of patients receiving ICIs with or without chemotherapy versus patients not receiving ICIs (receiving chemotherapy or placebo only) in non-squamous NSCLC (male: p = .005, female: p = .011, overall: p = .001).