
Figures & data
Figure 1. Prevalence of bacterial strains (number and percentage) isolated from patients with cystic fibrosis enrolled in the study.
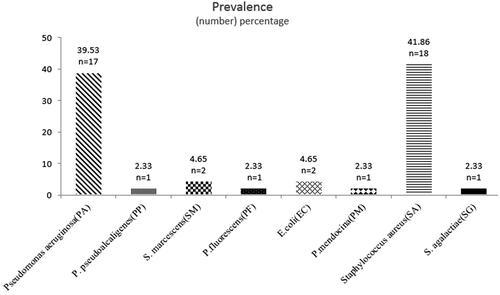
Table 2. Antibiotic susceptibility percent of isolated bacteria from patients with cystic fibrosis enrolled in the study.
Table 3. Biofilm formation profile of bacteria isolated from patients with cystic fibrosis enrolled in the study.
Table 4. MBEC (µg/mL) of tested antibiotics for bacteria isolated from patients with cystic fibrosis enrolled in the study.
Table 5. Frequency (percentage and number) of antibiotic resistance genes among Gram-negative and Gram-positive bacteria isolated from patients with cystic fibrosis enrolled in the study.
Table 1. Interpretation of optical density data for detection of biofilm formation [Citation15].
Supplemental Material
Download MS Word (993.4 KB)Supplemental Material
Download MS Word (993.4 KB)Data availability statement
All data generated or analyzed during this study are included in this article.
Table 1. Interpretation of optical density data for detection of biofilm formation [Citation15].