
Figures & data
Figure 1. Number of participants, and missing data for each parameter. N: number of valid files; M: males; and F: females.
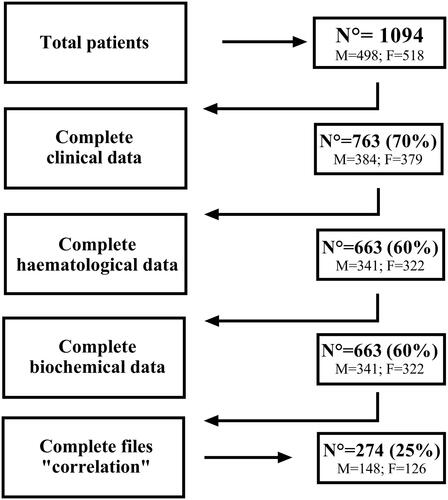
Figure 2. Patients’ distribution frequency per TOD (n = 1094). Data was processed using a One-way ANOVA with *** Means a significant difference compared to 00-04 h for male, female and overall. ### Means a significant difference compared to 04-08 h for male, female and overall.
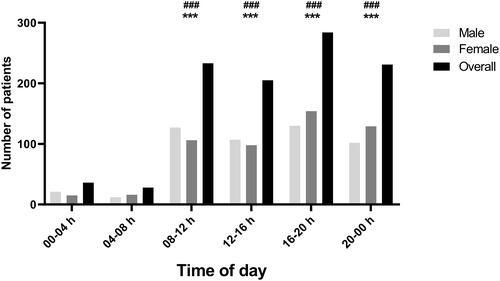
Table 1. Clinical, haematological and biochemical data at different TOD (in hours) in COVID-19 patients (n = 1094).
Figure 3. Male-Female comparison of different clinical, haematological and biochemical data at different TOD. Data was assessed using a two-way ANOVA followed by Bonferroni post-hoc test. *, ** and *** Significant sex-based difference at p < 0.05, p < 0.01 and p < 0.001. •, •• and ••• Means significant TOD difference in females at p < 0.05, p < 0.01 and p < 0.001. #, ## and ### means significant TOD difference in males at p < 0.05, p < 0.01 and p < 0.001.
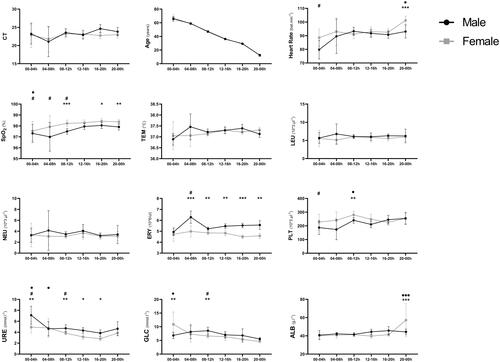
Table 2 Correlation-coefficient (r) between different clinical, haematological and biochemical data (n = 274).
Data availability statement
All data analysed and reported in this study are available from the first author on reasonable request.