
Figures & data
Table 1. Prevalence of adverse events according to patient and hospital admission characteristics.
Figure 1. Study diagram and results by phase. AE: health care-related adverse events; %: Prevalence data; MRF2: modular review Form 2.
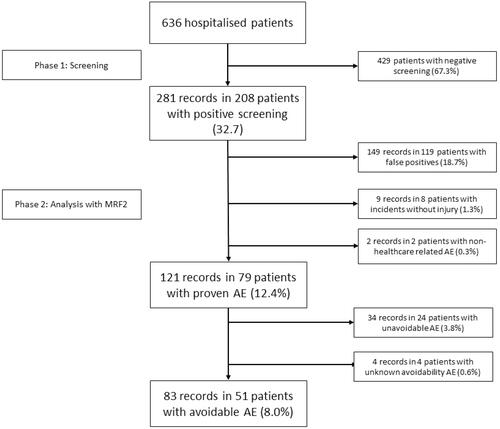
Table 2. Association between death and detection of AEs.
Table 3. Types of AE and their impact by avoidability.
Table 4. Risk factors associated with avoidable AE records.
Supplemental material
Supplemental Material
Download MS Word (15.9 KB)Data availability statement
The data that support the findings of this study are available from the corresponding author, JVG, upon reasonable request.