
Figures & data
Figure 1. Overexpression of full length TDP-43 leads to nuclear depletion of endogenous TDP-43 and formation of TDP-43 cytoplasmic inclusions. (A) Representative STED microscopy images of NSC-34 cells (n = 3) transfected with 20 µg of pCI-neo plasmid expressing human TDP-43 and analyzed immediately after and 40 h after transfection. Red fluorescence: total TDP-43 (endogenous and exogenous). Higher magnifications show round (left) and elongated (right) TDP-43 inclusions. (B) 3D reconstruction of the z-stack analysis (5-μm-thick slices) of the specimens shown in (A). A NSC-34 cell was virtually dissected on the zy plane to show more clearly the intracellular TDP-43 inclusions. Red and green fluorescence: cell membrane (WGA) and exogenous (human) TDP-43, respectively. Yellow and white arrows: round and elongated inclusions, respectively.
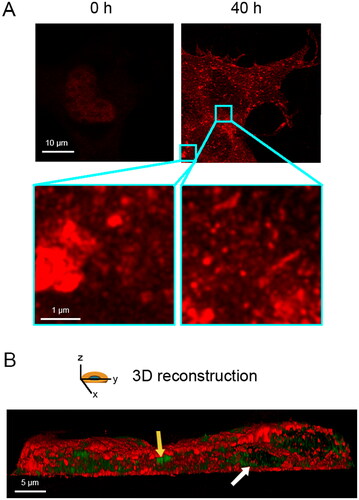
Figure 2. Cytoplasmic inclusions of TDP-43 do not stain with amyloid-diagnostic dyes able to cross biological membranes. Representative confocal microscopy images of NSC-34 cells (n = 3) transfected with vehicle, 0.15 μM BSA, 20 µg of pCI-neo plasmid expressing human TDP-43, or preformed Aβ42 fibrils at 2 µM monomer equivalents. Cells were then stained with Amytracker 630 (upper panels), Compound 3 (middle panels), and compound 4j (lower panels). Green and blue fluorescence: amyloid-bound diagnostic dyes and DAPI-stained nuclei, respectively.
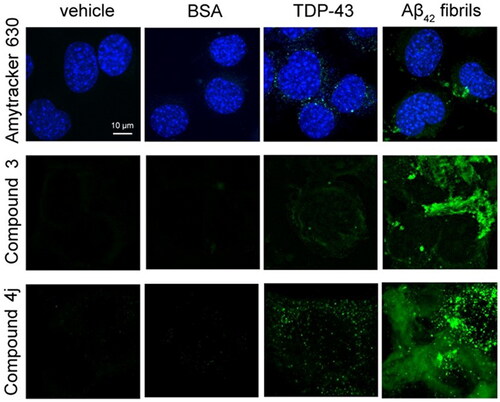
Figure 3. Cytoplasmic inclusions of TDP-43 do not have an enrichment of β-sheet structure. (A,B) Raman spectra (n = 15) of control cells (black) and TDP-43 expressing cells (red) in the 500–1200 cm−1 wavenumber range with excitation at 532 nm (A) and in the 1200–1800 cm−1 wavenumber range with excitation at 785 nm (B). (C,D) Magnification of the 1500–1800 cm−1 region (n = 15) containing the amide I band for control cells (C) and TDP-43 expressing cells (D), showing the experimental spectrum (black), the best fitted spectrum using a sum of five Lorentzian functions (red) and individual fitted components (indicated colors). (E) Quantification of secondary structure components for both control cells and TDP-43 expressing cells. The last column reports the data of the mammalian proteome [Citation49,Citation50]. (F) Difference spectrum obtained by subtracting the control cell spectrum from that of TDP-43 expressing cells: experimental (black), smoothed (grey), best fitted (red) spectrum, and individual fitted components (indicated colors). (G) Quantification of secondary structure components of the difference spectrum.
![Figure 3. Cytoplasmic inclusions of TDP-43 do not have an enrichment of β-sheet structure. (A,B) Raman spectra (n = 15) of control cells (black) and TDP-43 expressing cells (red) in the 500–1200 cm−1 wavenumber range with excitation at 532 nm (A) and in the 1200–1800 cm−1 wavenumber range with excitation at 785 nm (B). (C,D) Magnification of the 1500–1800 cm−1 region (n = 15) containing the amide I band for control cells (C) and TDP-43 expressing cells (D), showing the experimental spectrum (black), the best fitted spectrum using a sum of five Lorentzian functions (red) and individual fitted components (indicated colors). (E) Quantification of secondary structure components for both control cells and TDP-43 expressing cells. The last column reports the data of the mammalian proteome [Citation49,Citation50]. (F) Difference spectrum obtained by subtracting the control cell spectrum from that of TDP-43 expressing cells: experimental (black), smoothed (grey), best fitted (red) spectrum, and individual fitted components (indicated colors). (G) Quantification of secondary structure components of the difference spectrum.](/cms/asset/2e5a367e-ffcd-422a-990c-ffd48d45db37/iann_a_2148734_f0003_c.jpg)
Figure 4. Cytoplasmic inclusions of TDP-43 imaged with TEM accumulate in lysosomes and show a non-fibrillar morphology. (A) Representative electron micrograph showing lysosomal accumulation (arrowheads) in NSC-34 cells expressing TDP-43 after 40 h from transfection. Note the round shaped electron-dense inclusions within lysosomes (arrows). Plasma membrane (PM) and nucleus are also indicated. (B) Higher magnification image showing lysosomes (arrowheads) engulfed with electron-dense material and putative TDP-43 inclusions (arrows). (C) Further enlargement of an image showing a lysosome with non-fibrillar dense inclusions (arrows). (D) Positive control with a high magnification image of a lysosome from a primary neuron of PS19 mice expressing P301S mutant human tau (gene MAPT), showing filamentous inclusions (red arrowheads).
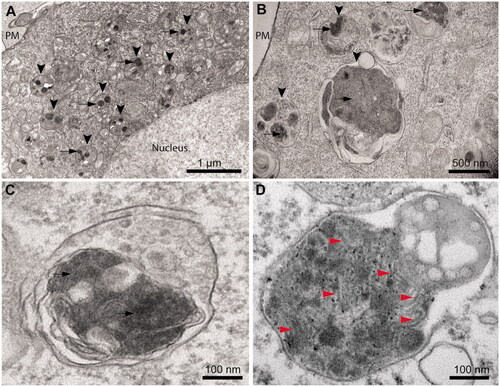
Figure 5. Tinctorial, structural and morphological analysis of TDP-43 aggregates formed in vitro from purified full-length TDP-43 show a non-amyloid nature. (A) ThT fluorescence spectrum in the presence of TDP-43 preincubated at a concentration of 5 µM, in 20 mM acetate buffer, 150 mM NaCl, 5% (w/v) PEG8000, 2 mM TCEP, pH 5.0 (Final pH 6.0), 25 °C, under agitation at 560 rpm for 4 days (solid line). The ThT-independent baseline deriving from aggregate-generated light scattering is shown (dotted line). The ThT fluorescence spectrum in the absence of protein (blank) is also shown (dashed line). (B) Far-UV CD spectrum of TDP-43 pre-incubated as described above. (C) Left: representative confocal microscopy images showing TMR-TDP-43 protein pre-incubated as described above. Center: higher magnifications of the aggregates shown from the boxed areas. Right: depth coding profiles along the xyz-axes of the 3D reconstruction of the same aggregates (different colors represent different planes along the xyz axes).
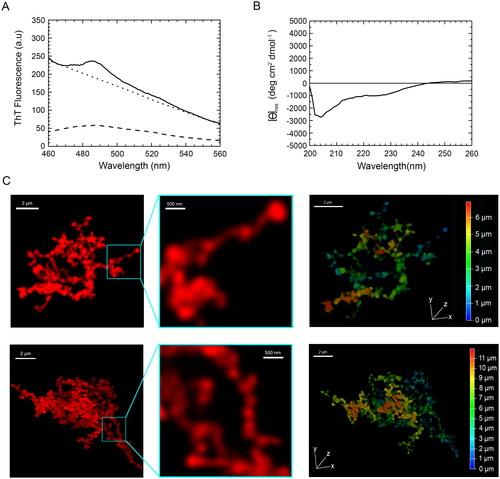
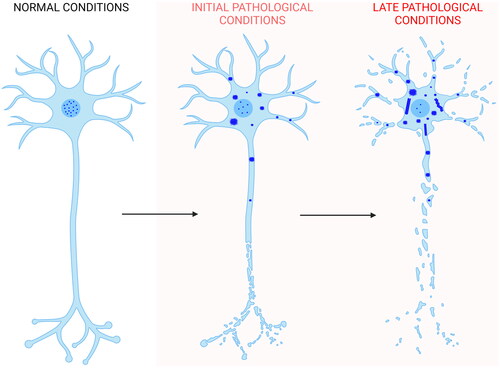
Figure 6. Scheme of TDP-43 inclusion formation. Self-assembly of full-length TDP-43 (blue) begins with the nucleus-to-cytoplasm mislocalization of the protein. In the cytoplasm it forms non-amyloid inclusions of different sizes. Later on, filaments distinct from the classical amyloid fibrils may or may not form. In the first case, they can either form directly from a structural reorganization of the initial inclusions, or from nuclei derived slowly, rarely, and independently of them. In the latter scenario, filaments would then rapidly grow from TDP-43 reservoirs provided by the initial non-filamentous inclusions. The process also involves phase separation within stress granules and TMEM106B CTD amyloid fibril formation, which have been neglected in the figure for simplicity (Created with BioRender.com).
Supplemental Material
Download MP4 Video (877.8 KB)Supplemental Material
Download MS Word (960.3 KB)Data availability statement
The data that support the findings of this study are available on request from the corresponding author.