
Figures & data
Table 1. Baseline characteristics of 203 CRC patients.
Figure 1. Characterization of CRC-associated HEV and the patient survival outcomes. (A) Representative images of immunohistochemistry staining CRC tissues and adjacent tissue showing the expression of HEV (black arrowheads). The solid black line indicates the scale bar, 100 mm. (B–C) Kaplan-Meier curves were used for comparison of OS and RFS among patients with negative or positive HEV expression. Significance was tested by log-rank test. (D–G) Kaplan-Meier curves for OS and RFS in different stage CRC patients with negative or positive HEV expression. Significance was tested by log-rank test. OS: overall survival; DFS: disease-free survival; HEV: high endothelial venules.
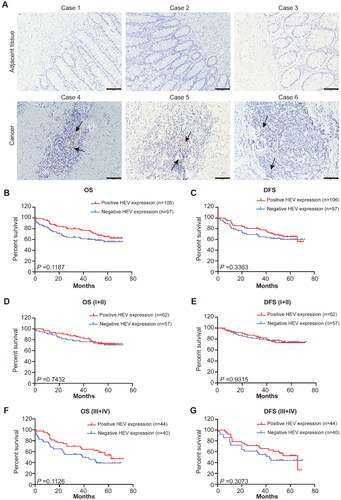
Table 2. Correlation between HEV expression and clinicopathological characteristics of CRC (n = 203).
Table 3. Analysis for OS using the univariate and multivariate Cox proportional hazards regression model in the patient with CRC (n = 203).
Table 4. Analysis for DFS using the univariate and multivariate Cox proportional hazards regression model in the patient with CRC (n = 203).
Figure 2. Characterization of different HEV/TLS and the patient survival outcomes. (A) Representative images of immunohistochemistry staining CRC tissues showing the different HEV/TLS (black arrowheads represent the HEV, black dotted lines are TLS, the top row is low HEV/TLS and the bottom row is high HEV/TLS). The solid black line indicates the scale bar, 100 mm. (B–C) Kaplan-Meier curves were used for comparison of OS and RFS in the CRC patient among three groups (High HEV/TLS vs. Low HEV/TLS vs. negative HEV expression). Significance was tested by log-rank test. (D–G) Kaplan-Meier curves for OS and RFS in different stage CRC patients with high HEV/TLS or low HEV/TLS. Significance was tested by log-rank test. (H–I) Kaplan-Meier curves for OS and RFS in CRC patients in the different group (High HEV/TLS vs. None or Low HEV/TLS). OS: overall survival; DFS: disease-free survival; HEV: high endothelial venules.
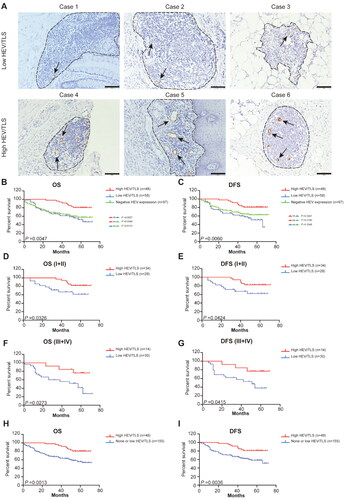
Table 5. Correlation of HEV/TLS with clinicopathological characteristics (n = 203).
Table 6. Analysis for OS using the univariate and multivariate Cox proportional hazards regression model in the patient with the HEV expression (n = 203).
Table 7. Analysis for DFS using the univariate and multivariate Cox proportional hazards regression model in the patient with colorectal cancer (n = 203).
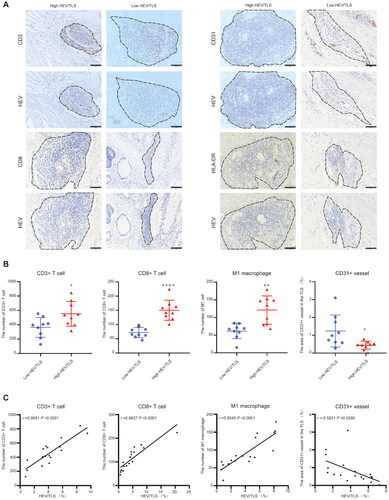
Figure 3. Relationship between different HEV/TLS and the immune cell infiltration in CRC tissue. (A) Representative images of immunohistochemistry staining CRC tissues showing the different HEV/TLS (black dotted lines represent TLS, the top row is low HEV/TLS and the bottom row is high HEV/TLS). The solid black line indicates the scale bar, 100 mm. (B) The number of CD3+, CD8+ T cell and HLA-DR + M1 macrophage and area of CD 31+ vessel was compared between CRC patients with high HEV/TLS or low HEV/TLS (each group, n = 9; *, p < 0.05; **, p < 0.001, ****, p < 0.0001). (C) Correlation analysis between HEV/TLS and the number of CD3+, CD8+ T cell and HLA-DR + M1 macrophage and area of CD 31+ vessel (each group, n = 18).
Supplemental Material
Download MS Word (245.4 KB)Data availability statement
The original contributions presented in the study are included in the article. Further inquiries can be directed to the corresponding author.