
Figures & data
Figure 1. Changes in the incidence rate and the number of incident cases of NMSC in Hong Kong, 1990–2019. (A) Number of cases. (B) Age-standardized incidence rate and crude incidence rate.
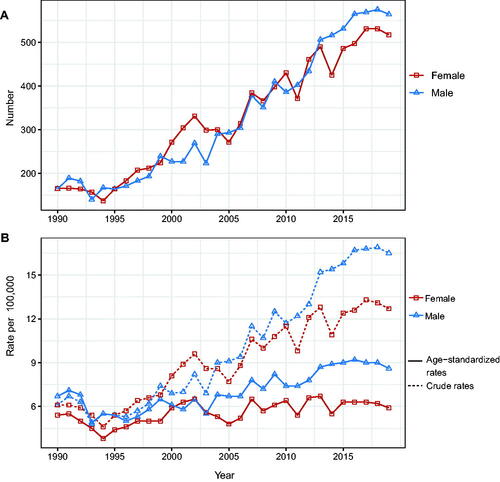
Figure 2. Local drifts with net drifts for NMSC incidence in Hong Kong from 1990 to 2019. Shaded areas indicate the 95% confidence interval of local drift. The horizontal lines represent the net drifts, and the horizontal dashed line corresponds to 95% confidence intervals.
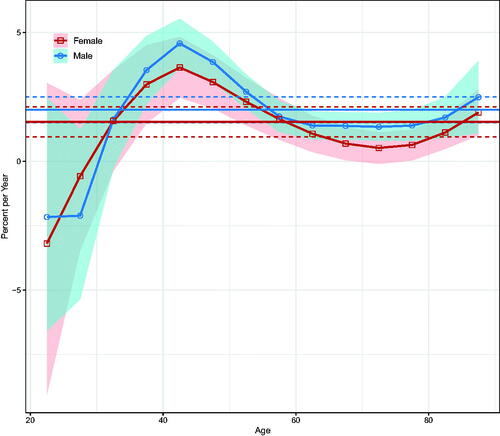
Figure 3. Age, calendar period, and birth cohort effects with the corresponding 95% confidence intervals on NMSC incidence rates in Hong Kong, 1990–2019. (A) Longitudinal curves of fitted age-specific rates in reference cohort adjusted for period effects; (B) rate ratios in each period relative to the reference period, adjusted for age and non-linear cohort effects; (C) rate ratios in each cohort relative to reference cohort, adjusted for age and non-linear period effects.
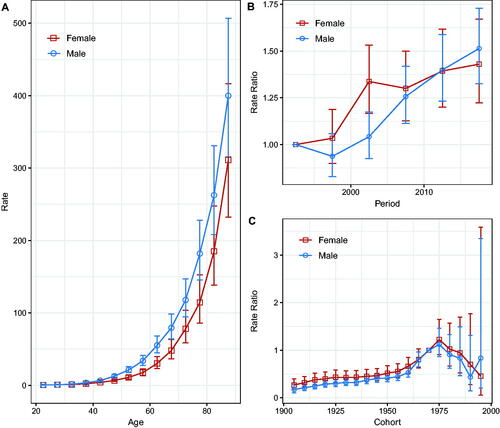
Figure 4. Trends and projected incidence rates for NMSC in Hong Kong men. Dots represent fitted points. Data on the right of the dashed line were projected data. Each lighter shade of blue represents an additional 10% CI.
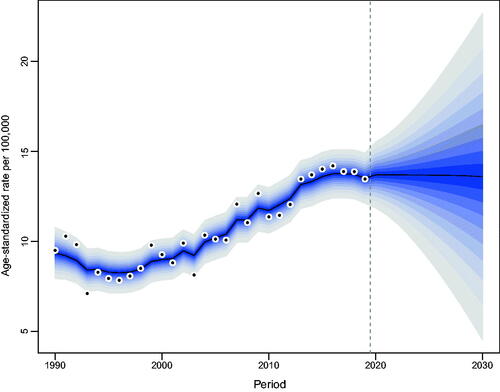
Figure 5. Trends and projected incidence rates for NMSC in Hong Kong women. Dots represent fitted points. Data on the right of the dashed line were projected data. Each lighter shade of blue represents an additional 10% CI.
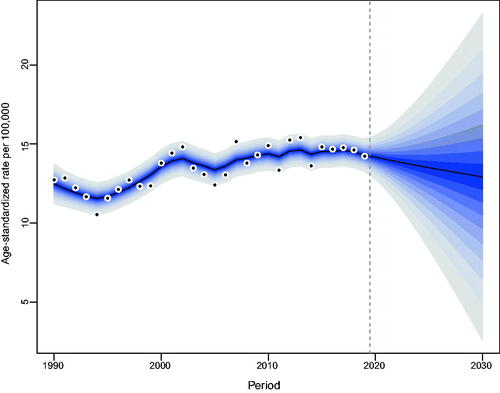
Figure 6. Contribution of changes in population aging, population growth, and age-specific incidence rate to changes in the number of incident NMSCs from 1991 to 2030 for Hong Kong men, using 1990 as the reference year. Data on the right of the blue dashed line was the decomposition based on the projected data.
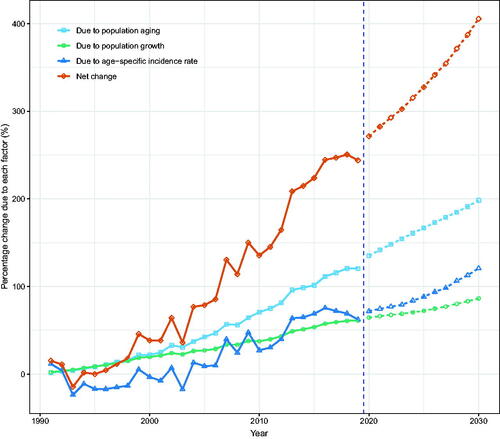
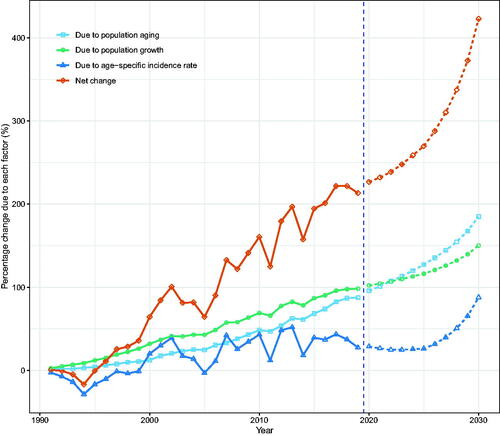
Figure 7. Contribution of changes in population aging, population growth, and age-specific incidence rate to changes in the number of incident NMSCs from 1991 to 2030 for Hong Kong women, using 1990 as the reference year. Data on the right of the blue dashed line was the decomposition based on the projected data.
Supplemental Material
Download MS Word (43.3 KB)Data availability statement
Publicly available datasets were analyzed in this study. The data can be found at Hong Kong Cancer Registry http://www3.ha.org.hk/cancereg/allages.asp/.