
Figures & data
Table 1. Characteristics of study participants (n = 74).
Table 2. Characteristics for each cluster in the 4-cluster model and comparisons between clusters.
Figure 1. Proportion of subjects with Box and Block Test scores stratified by quartile (Q1 - Q4) at each time point for each of the 4 clusters. • The KEY displays BBT scores stratified by quartiles for the whole cohort, at each time point. • The stacked columns represent the proportion of subjects within each cluster who scored within a particular quartile for each week. For example, a high proportion of subjects assigned to Cluster 1 had BBT scores in the lowest quartile (Q1) for all weeks.
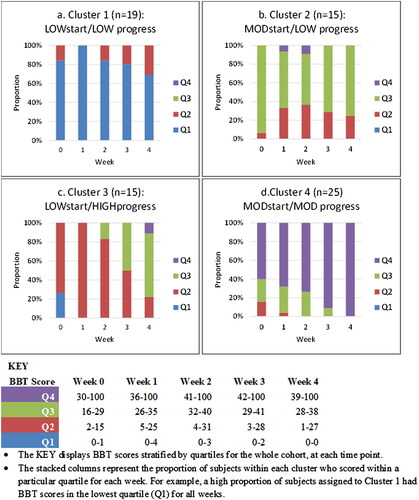
Table 3. Goodness of fit criteria for 2-cluster to 6-cluster models.
Figure 2. Weekly Box and Block Test scores by cluster. Light grey lines represent individual trajectories. Blue lines represent averaged trajectory per cluster.
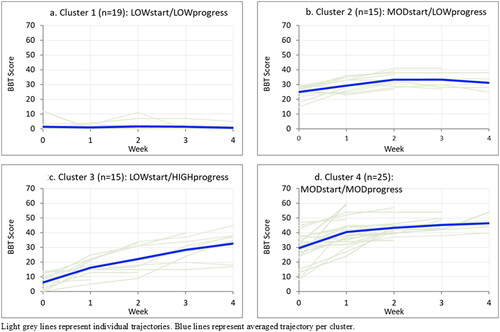
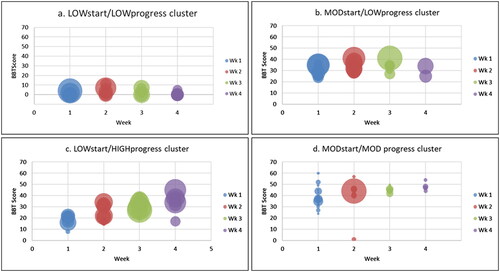
Figure 3. Participants Box and Block Test (BBT) scores plotted by week. Each bubble represents an individual score with bubble diameter representing number of repetitions completed per week (Overall Repetitions Range: 0–10,196; Mean (SD) 268.3 (722.1); Median (IQR): 117 (301) (greater diameter = higher number of repetitions completed).
Data availability statement
The data that support the findings of this study are available from the corresponding author, AVC, upon reasonable request.