
Figures & data
Figure 1. Data screening process from the hospital database (1a) and SEER database (1b).
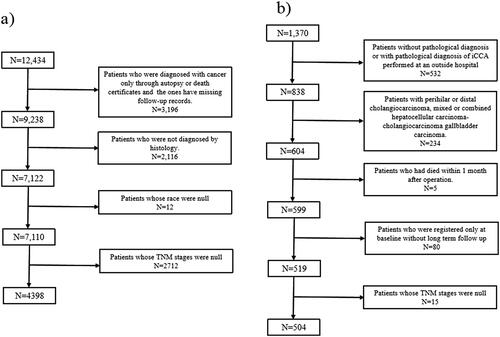
Table 1. Demographic characteristics from SEER database and the Fifth Medical Center of PLA General Hospital dataset.
Table 2. Univariate cox regression analysis of two database.
Figure 2. Time-dependent AUC for the three models (Dash-line: mean AUC).
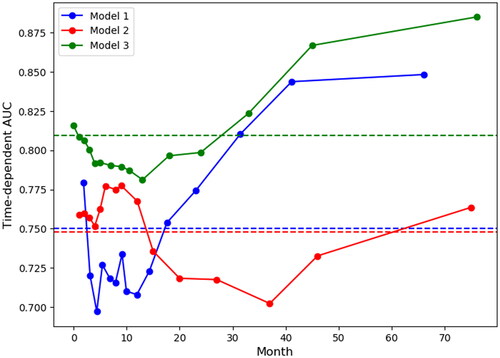
Table 3. Model performance summary.
Figure 3. SHAP summary plots of three models.
Note: Each point on the plot represents a particular feature of a particular patient. Its y-coordinate is determined by the feature that the point represents, and its x-coordinate is determined by its impact on the model’s output, which, in our case, is the risk score. The color of the point indicates its value from high to low, according to the color bar on the right. The features on the y-axis are ordered by their importance.
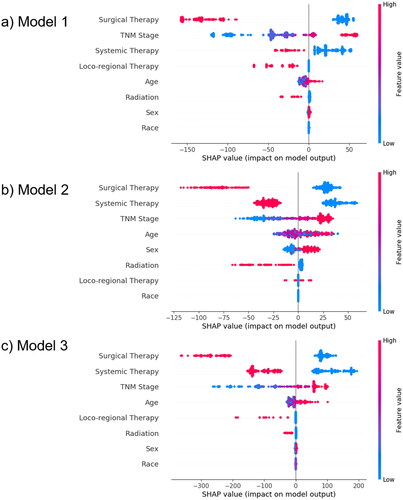
Table 4. Feature importance calculated based on permutation importance.
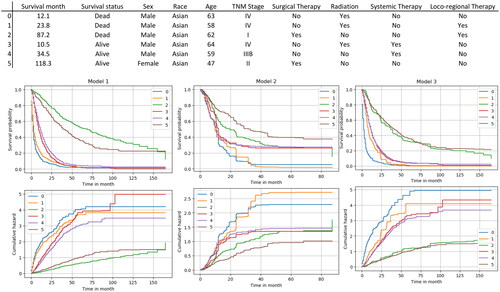
Figure 4. Six random patients’ survival functions and cumulative hazard functions were predicted by three different models.
Supplemental Material
Download MS Word (11.2 KB)Supplemental Material
Download PNG Image (558.7 KB)
Data availability statement
The data that support the findings of this study involve two parts: data from the SEER are available from the author Chun Liu, and the data from the hospital are regulated by Chinese law, so only authorized staff can access the confidential data and the details can be discussed with the corresponding author Dr. Ning Zhang.