
Figures & data
Figure 1. Forest plot of independent predictors of delayed extubation. BMI: body mass index; FEV1: forced expiratory volume in 1 s; FVC: forced vital capacity; TPVB: thoracic paravertebral blockade.
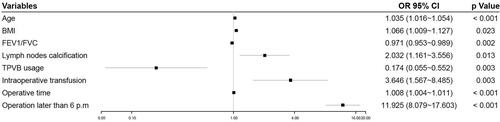
Figure 2. A novel nomogram to predict delayed extubation. The nomogram provides a visual point system based on the combination of patient characteristics (age, BMI, FEV1/FVC, lymph nodes calcification, combined with TPVB, intraoperative transfusion, operative time and operation later than 6 p.m.) to estimate the probability of delayed extubation. To calculate the probability of delayed extubation, the points of eight variables determined on the scale were added to obtain the total points. Draw a vertical line from the total points scale to the last axis to obtain the corresponding probability of delayed extubation. BMI: body mass index; FEV1: forced expiratory volume in 1 s; FVC: forced vital capacity; TPVB: thoracic paravertebral blockade.
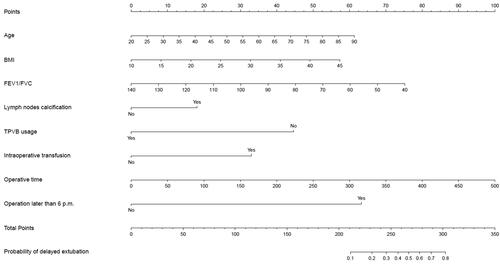
Table 1. Preoperative and intraoperative patient characteristics.
Figure 3. AUROC curve analysis of the development (A) and validation cohort (B).
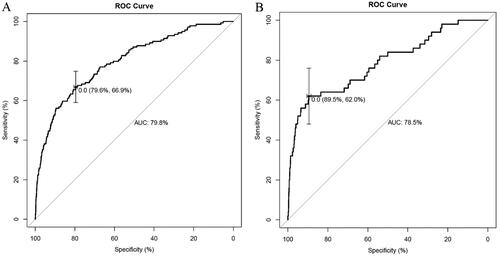
Figure 4. Internal calibration curves. A completely accurate prediction model will generate a plot where the probability of the actual observed and predicted corresponding completely and fall along the 45°line (dashed line). The apparent calibration curve (dotted line) represents the calibration of the model in the development data set, while the bias-corrected curve (solid line) is the calibration result after correcting the optimism with the 1000 bootstrap-resampling.
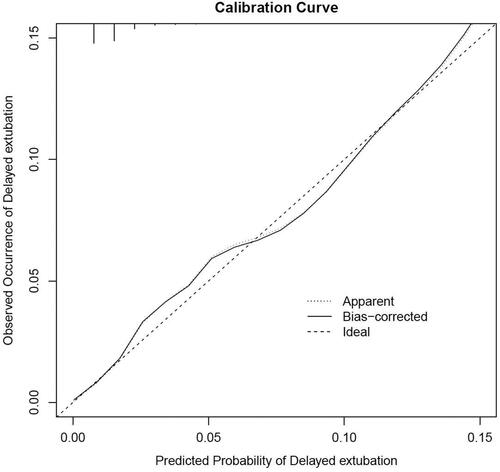
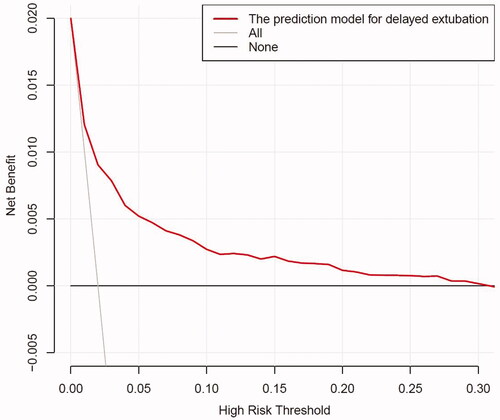
Figure 5. The DCA shows the clinical usefulness of the nomogram. The Y-axis represents net benefit. The bold solid black line is a nomogram predicting the risk of delayed extubation. The solid grey line indicates that all patients occurred delayed extubation, while the fine solid black line indicates that no patient occurred delayed extubation. This DCA could provide a larger net benefit, with ranges of 0% to 30%. DCA: decision curve analysis .
Supplemental Material
Download MS Word (160.3 KB)Data availability statement
Our research team could provide original data under reasonable request and with permission from Shanghai Chest Hospital.