
Figures & data
Figure 1. The map of Turkey that geographically represents the study centres and the included isolates from each centre.
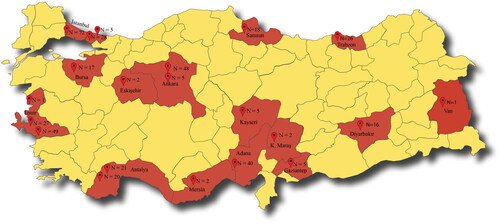
Table 1. Year-wise number of isolates obtained from 21 centres included in the study.
Figure 2. Serotypes covered by PCV13, PCV15, PCV20 and PPV23.
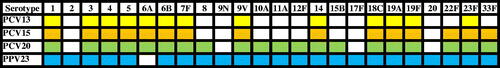
Figure 3. Changes in antibiotic non-susceptibility in years.
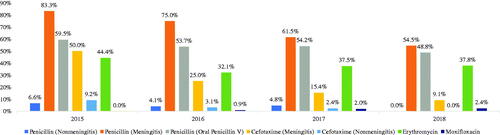
Table 2. Antibiotic non-susceptibility according to age groups.
Table 3. Distribution of isolated serotypes according to age groups.
Table 4. Coverage of pneumococcal vaccines according to age groups.
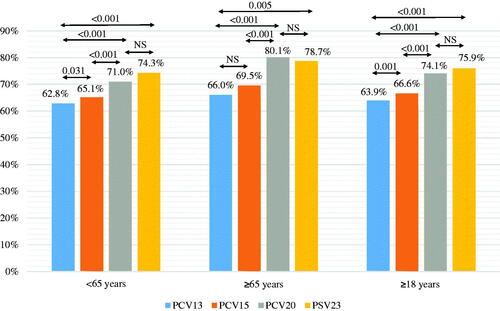
Figure 4. Comparison of the coverage of pneumococcal vaccines.
Data availability statement
The data that support the findings of this study are available from the corresponding author, Gulsen Hascelik, upon reasonable request.