Figures & data
Figure 1. Details of the fusion genes and gene mutations among the 31 patients. The proportion of patients in the cohort with each alteration is reported on the right side of the figure. Columns represent individual patients, and rows represent clinical variables or the presence of gene mutations and fusion genes identified at diagnosis. The most common gene mutation among the 31 patients was FLT3-ITD. The most common fusion gene was the NUP98 rearrangement.
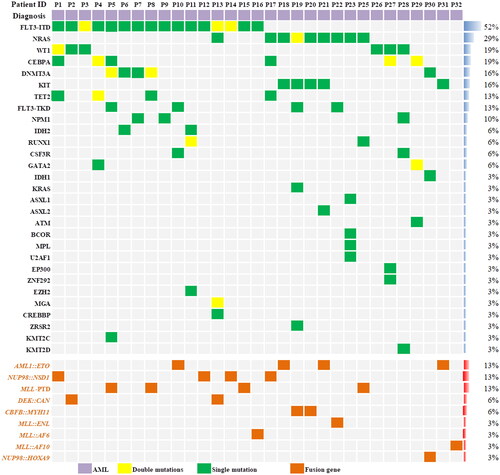
Figure 2. Plasma concentration of venetoclax. Venetoclax was administered orally daily for 5 days. Days 1–5 was Cmax. Days 6–14 was morning plasma concentrations after discontinuation of venetoclax.
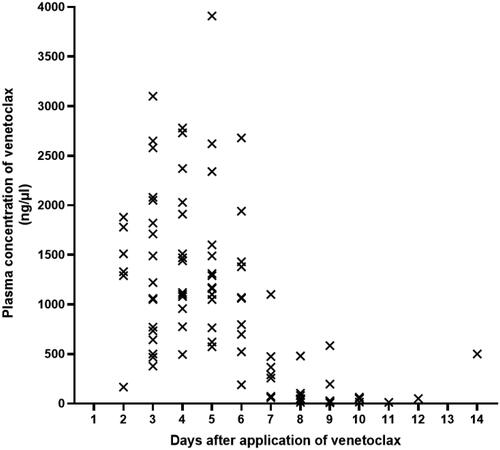
Table 1. Patient, disease, and transplant characteristics (n = 31).
Figure 3. Serial minimal residual disease (MRD) monitoring before and after transplant. MRD was detected by flow cytometry and gene quantification, and a negative result using both methods was defined as negative. Each bar represents a patient, with the length of the gray bars indicating follow-up time. Symbols indicate MRD, relapse or death at serial time points.
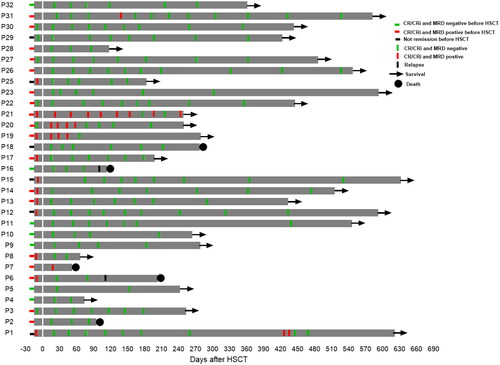
Figure 4. Changing chimerism rate trends of CD3 positive cells in peripheral blood. Patient 1(P1) had DLI on day 25 post-transplant at a dose of 1 × 10⁷/kg, resulting in a final chimerism rate of 100%. Patients 15 and 18 achieved 100% chimerism after reduction in the dose of immunosuppressants. Patient 6 experienced a decrease in peripheral blood CD3+ cells chimerism 112 days after transplantation. This patient later died of relapse.
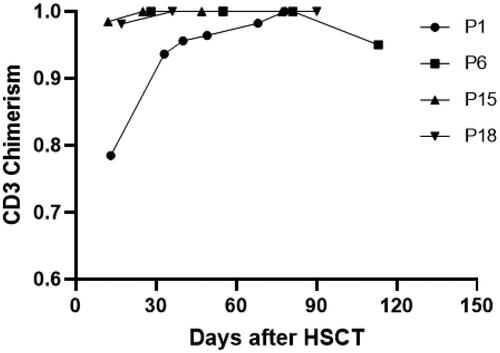
Table 2. Summary of treatment-related adverse events according to CTCAE, version5.0.
Figure 5. Overall survival(OS), leukemia-free survival(LFS), non-relapse mortality(NRM) and relapse incidence(RI) for the 31 patients. (A) Probabilities of OS and LFS and (B) Probabilities of NRM and RI.
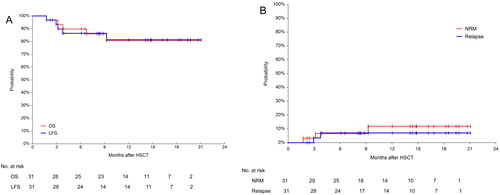
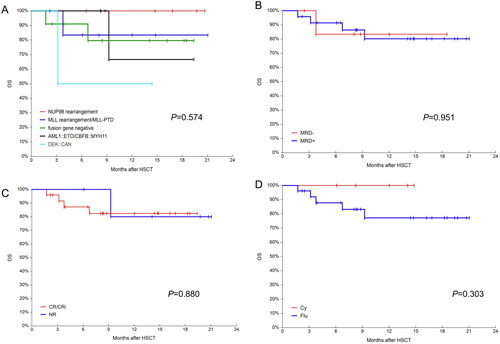
Figure 6. OS in different groups. (A) Probabilities OS in different fusion genes groups; (B) probabilities OS in MRD negative and positive groups; (C) probabilities OS in CR/CRi and NR groups and (D) probabilities OS in busulfan/ cyclophosphamide(Bu/Cy) and busulfan/fludarabine(Bu/Flu) conditioning regimens groups.