
Figures & data
Table 1. Demographic characteristics of the oncology patients (N = 256).
Figure 1. Distribution of oncology patients’ willingness to pay and the price of the COVID-19 vaccine booster. (A) Distribution of willingness to pay for the booster dose of COVID-19 vaccine (N = 256). (B) Distribution of prices that are acceptable to patients who are willing to pay for the COVID-19 vaccine booster (N = 176).
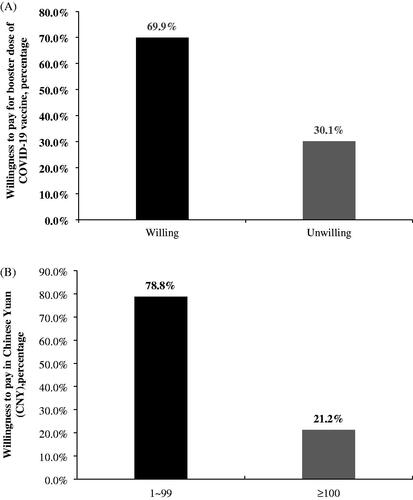
Figure 2. Relationship between COVID-19 vaccine hesitancy and willingness to pay for the COVID-19 vaccine booster (N = 256).
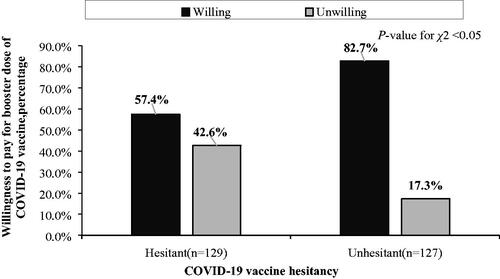
Table 2. Logistic regression of factors associated with willingness to pay for booster dose of COVID-19 vaccine (N = 256).
Data availability statement
All data underlying the findings are within the paper.
The data that support the findings of this study are available from the corresponding author, T.H.T, upon reasonable request.