
Figures & data
Figure 1. Domain structure and chromosomal localization of human RSPOs. The lengths of RSPO1-4 are 263, 243, 292, and 234 amino acids, respectively. SP: signal peptide; FU: The furin-like cysteine-rich region; TSP1: thrombospondin type 1 repeats; LC: low complexity region.
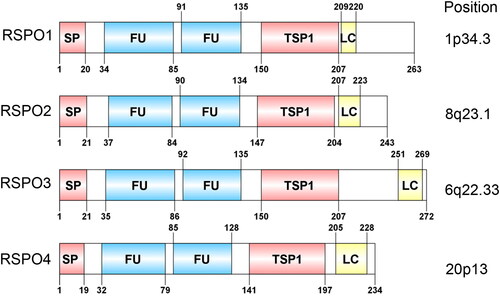
Figure 2. The canonical Wnt pathway and the potentiating effect of RSPOs. Canonical Wnt ligands induce the activation of DVL and inhibit the activity of the destruction complex, leading to β-catenin accumulation, nuclear translocation, and transcription of Wnt target genes. RSPOs enhance the canonical Wnt/β-catenin signaling pathway by eliminating the negative regulator ZNRF3/RNF43, thus enhancing the availability of membrane Wnt receptors and Wnt ligand-mediated pathway activation. In the absence of canonical Wnt ligands, the destruction complex induces β-catenin phosphorylation. The phosphorylated β-catenin is degraded by the cytoplasmic proteasome.
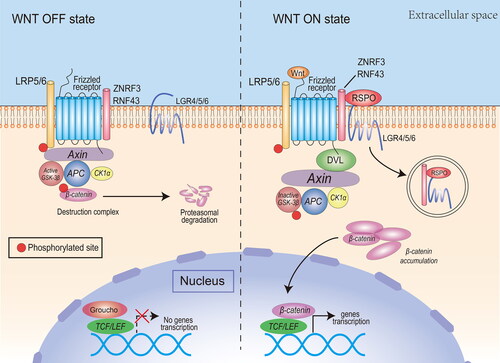
Figure 3. Functions of the RSPO family in vivo. The RSPO family has a wide range of biological functions, including reproductive system development, limb musculoskeletal development, angiogenesis, respiratory and digestive system development, and other biological activities.
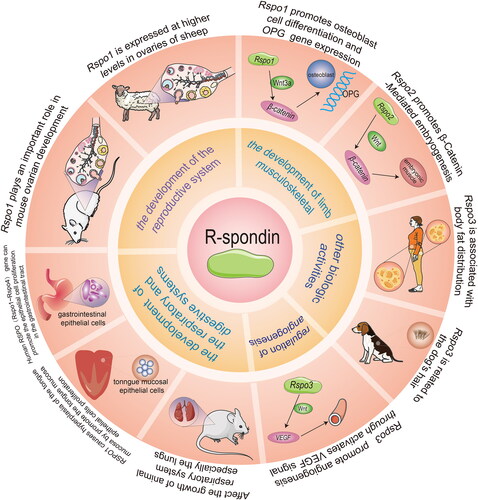
Figure 4. Expression matrix plots of RSPOs in multiple tumors. The density of color in each block represents the median expression value of a gene in a given tissue, normalized by the maximum median expression value across all blocks.
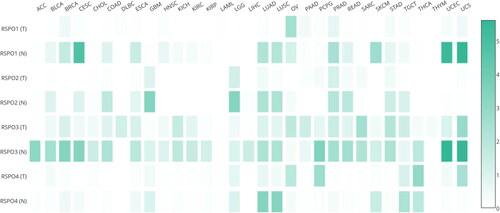
Table 1. TFs predictions of Rspos promoters.
Figure 5. Univariate cox analysis results of RSPOs in multiple tumors. Forest plot: The p-value, risk coefficient (HR), and confidence interval of RSPOs in multiple tumors are analyzed by univariate cox regression.
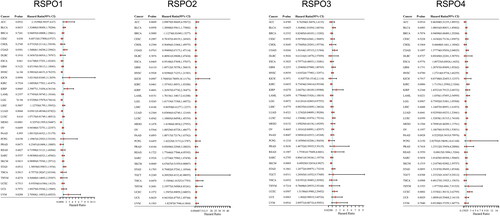
Figure 6. Spearman correlation analysis of TMB and RSPOs expression. The abscissa represents the correlation coefficient between genes and TMB, the ordinate represents different tumors. The size of the dots represents the size of the correlation coefficient, and different colors represent the significance of the p-value. The deeper the blue color, the smaller the p-value.
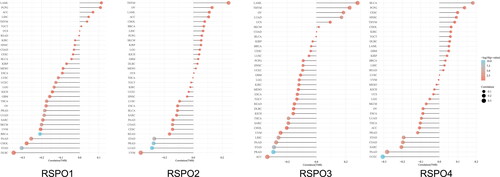
Table 2. Genetic mutations of Rspos.