
Figures & data
Table 1. Clinical and demographic characteristics of the patients with type 2 diabetes (n = 16).
Figure 1. Shows for patient no. 16 whole blood size-dependent platelet populations after ɑ-thrombin (10 U/mL) provocation as determined by flow-cytometry. The illustration demonstrates the size-dependent platelet subfractions (normal-sized, small platelets, and vesicles) together with manual the gating of the device.
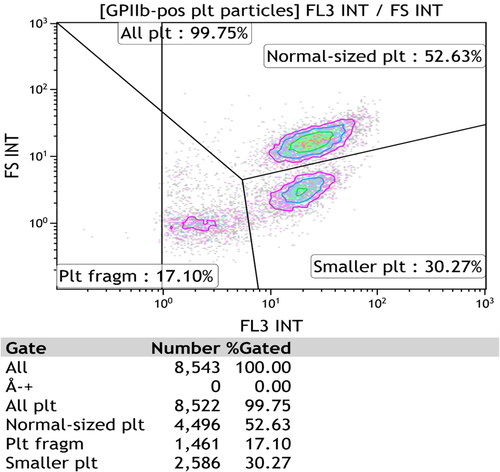
Table 2. The flow cytometry technique, i.e. the determinations, antibodies, probes, final concentrations, manufacturers, and lot numbers.
Figure 2. Surface LAMP-1 (left) and PAC-1 (right) expressions (mean ± SD) of circulating density-separated normal-sized platelets divided into low- and high-responders according to WB LAMP-1 expression after ɑ-thrombin provocation (10 U/mL). The colors indicate statistical significance (red, p < 0.01; yellow, p < 0.05; black, not significant) between the pairs. For each pair, the left bar summarizes WB ɑ-thrombin low-responders (L), and the right bar shows high-responding participants (H). A–D denote the density intervals. A: density subpopulations nos. 1–4; density span 1.090–1.079 kg/L. B: density subpopulations nos. 5–8; density span 1.079–1.067 kg/L. C: density subpopulations nos. 9–12; density span 1.067–1.054 kg/L. D: density subpopulations nos. 13–16; density span 1.054–1.040 kg/L. LAMP-1: lysosomal-associated membrane protein 1; nos.: numbers; PAC-1: fibrinogen receptor (αIIbβ3) activity; SD: standard deviation; WB: whole blood. The number (mean ± SD) of normal-sized platelets evaluated using flow cytometry for the density fractions (nos. 1–16): (1) 87 ± 95; (2) 320 ± 311; (3) 594 ± 688; (4) 1244 ± 1812; (5) 2578 ± 1812; (6) 4631 ± 904; (7) 4814 ± 844; (8) 5138 ± 118; (9) 5261 ± 158; (10) 5305 ± 212; (11) 5139 ± 871; (12) 3831 ± 1738; (13) 2718 ± 1602; (14) 2053 ± 1813; (15) 1585 ± 1296; (16) 1012 ± 605.
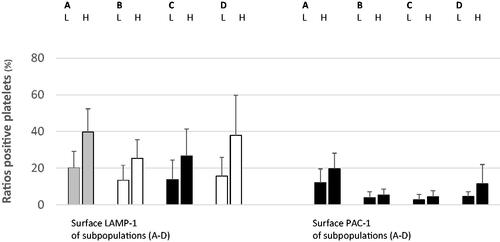
Figure 3. Membrane LAMP-1 (left) and PAC-1 (right) (mean ± SD) of density-separated normal-sized platelets split according to WB PAC-1 responses after ɑ-thrombin provocation (10 U/mL). The colors denote significance (red, p < 0.01; yellow, p < 0.05; black, not significant). For each pair, the left and right bars display WB ɑ-thrombin low- (L) and high- (H) responders, respectively. A–D denote the density intervals. A: density subpopulations nos. 1–4; density span 1.090–1.079 kg/L. B: density subpopulations nos. 5–8; density span 1.079–1.067 kg/L. C: density subpopulations nos. 9–12; density span 1.067–1.054 kg/L. D: density subpopulations nos. 13–16; density span 1.054–1.040 kg/L. LAMP-1: lysosomal-associated membrane protein 1; nos.: numbers; PAC-1: fibrinogen receptor (αIIbβ3) activity; SD: standard deviation; WB: whole blood. The quantities (mean ± SD) of normal-sized platelets assessed by the flow cytometer apparatus for the density fractions (nos. 1–16) are given in the legend of .
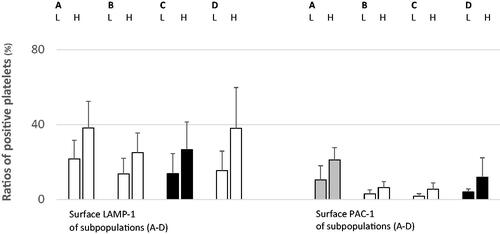
Figure 4. Surface LAMP-1 (left) and PAC-1 (right) (mean ± SD) expressions of density-separated ordinary platelets divided according to WB annexin V after ɑ-thrombin stimulation (10 U/mL). The colors illustrate statistical significance (red, p < 0.01; yellow, p < 0.05; black, not significant). For each couple, the left bar demonstrates WB ɑ-thrombin low-responders (L), and the right one shows their high-responding counterparts (H). A–D indicate the density intervals. A: density subpopulations nos. 1–4; density span 1.090–1.079 kg/L. B: density subpopulations nos. 5–8; density span 1.079–1.067 kg/L. C: density subpopulations nos. 9–12; density span 1.067–1.054 kg/L. D: density subpopulations nos. 13–16; density span 1.054–1.040 kg/L. LAMP-1: lysosomal-associated membrane protein 1; nos.: numbers; PAC-1: fibrinogen receptor (αIIbβ3) activity; SD: standard deviation; WB, whole blood. The numbers (mean ± SD) of normal-sized corpuscles evaluated by the flow cytometer for the density fractions (nos. 1-16) are shown in .
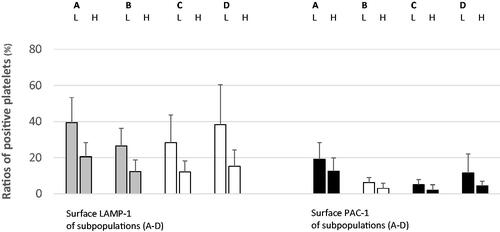
Figure 5. Surface LAMP-1 (left) and PAC-1 (right) (mean ± SD) of density separated normal-sized platelets divided according to WB DiIC1(5) responses after ɑ-thrombin provocation (10 U/mL). In this setting, a high DiIC1(5) denotes less disintegrated mitochondria. The colors designate the levels of significance (red, p < 0.01; yellow, p < 0.05; black, not significant). For each pair, the left bar (L) summarizes patients with more disintegrated WB platelet mitochondria after ɑ-thrombin provocation. The right bar (H) displays patients showing more retained organelles after stimulation. A–D denote the density intervals. A: density subpopulations nos. 1–4; density span 1.090–1.079 kg/L. B: density subpopulations nos. 5–8; density span 1.079–1.067 kg/L. C: density subpopulations nos. 9–12; density span 1.067–1.054 kg/L. D: density subpopulations nos. 13–16; density span 1.054–1.040 kg/L. DiIC1(5): mitochondrial transmembrane potential, that is, retention of 1,1′,3,3,3′,3′-hexamethylindodicarbocyanine iodide; LAMP-1: lysosomal-associated membrane protein 1; nos.: numbers; PAC-1: fibrinogen receptor (αIIbβ3) activity; SD: standard deviation; WB: whole blood. The numbers (mean ± SD) of normal-sized corpuscles evaluated by the flow cytometer for the density fractions (nos. 1–16) are shown in .
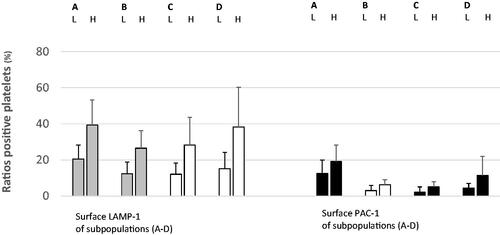
Table 3. Spontaneous whole blood lysosomal exocytosis (surface LAMP-1), fibrinogen receptor activity (PAC-1), annexin V, DiIC1(5), and corresponding surface activity markers of medium-dense normal-sized platelets subpopulations after processing and density separation.
Data Availability statement
Raw data are available from the corresponding author upon reasonable request.