
Figures & data
Figure 1. Flow chart indicates patient enrollment.
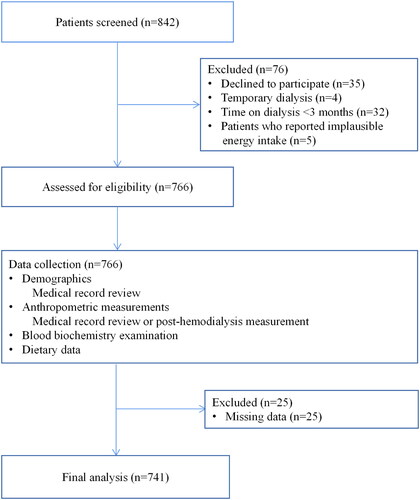
Table 1. Baseline characteristics of study participants according to dietary fibre intake levels.
Table 2. Diet characteristics of study participants according to dietary fibre intake levels.
Table 3. Adjusted hazard ratio (OR) and 95% confidence interval (CI) for the association between dietary fibre intake and the risk of poor sleep quality.
Table 4. Stratified analyses for adjusted hazard ratio (OR) and 95% confidence interval (CI) for the association between dietary fibre intake and the risk of poor sleep quality.
Figure 2. The dose-response curve of the relationship between total dietary fiber (A), total soluble dietary fiber (B), and total insoluble dietary fiber (C) consumption and poor sleep quality. The red line and shaded area represent the estimated ORs and the 95% confidence intervals. The black horizontal short, dashed line represents reference line y = 1.
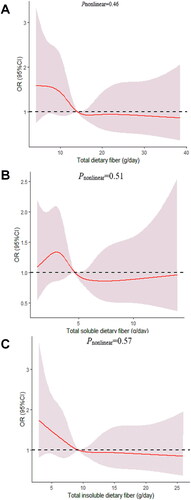
Figure 3. The dose-response curve of the relationship between total dietary fiber in vegetables (A), soluble dietary fiber in vegetables (B), and insoluble dietary fiber in vegetables (C) consumption and poor sleep quality. The red line and shaded area represent the estimated ORs and the 95% confidence intervals. The black horizontal short, dashed line represents reference line y = 1.
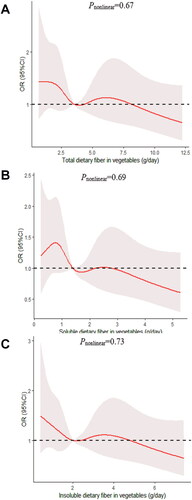
Figure 4. The dose-response curve of the relationship between total dietary fiber in fruits (A), soluble dietary fiber in fruits (B), and insoluble dietary fiber in fruits (C) consumption and poor sleep quality. The red line and shaded area represent the estimated ORs and the 95% confidence intervals. The black horizontal short, dashed line represents reference line y = 1.
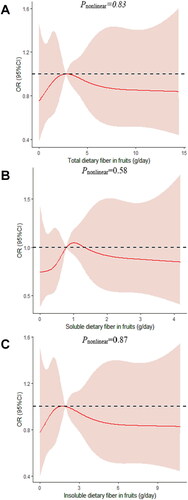
Figure 5. The dose-response curve of the relationship between total dietary fiber in cereals (A), soluble dietary fiber in cereals (B), and insoluble dietary fiber in cereals (C) consumption and poor sleep quality. The red line and shaded area represent the estimated ORs and the 95% confidence intervals. The black horizontal short, dashed line represents reference line y = 1.
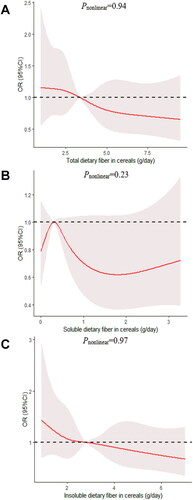
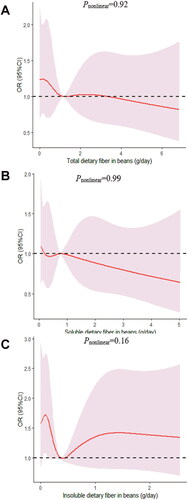
Figure 6. The dose-response curve of the relationship between total dietary fiber in beans (A), soluble dietary fiber in beans (B), and insoluble dietary fiber in beans (C) consumption and poor sleep quality. The red line and shaded area represent the estimated ORs and the 95% confidence intervals. The black horizontal short, dashed line represents reference line y = 1.
Supplemental Material
Download MS Word (118 KB)Supplemental Material
Download MS Word (118 KB)Supplemental Material
Download MS Word (116.5 KB)Supplemental Material
Download MS Word (116.5 KB)Data availability statement
The datasets used and/or analyzed during the current study are available from the corresponding author upon reasonable request.