
Figures & data
Table 1. Cut-off point of PDGF (ng/mL) by X-tile method.
Table 2. Baseline characteristics of the patients with NSTEMI in different PDGF levels.
Table 3. Baseline characteristics of the patients stratified by MACEs.
Figure 1. Correlation between plasma PDGF levels and other biomarkers. Panels A–F represent the correlation between plasma PDGF levels and mean cell haemoglobin concentration (MCHC), mean platelet volume (MPV), platelet-larger cell ratio (P-LCR), D-dimer, N-terminal pro-B type natriuretic peptide (NT-proBNP), and hypersensitive troponin T (hs-cTNT), respectively.
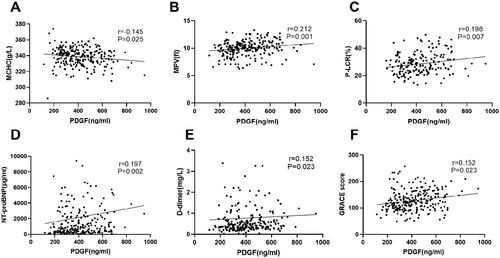
Figure 2. Kaplan–Meier survival curves of MACEs in 242 NSTEMI patients. (A) 30-day MACEs. (B) 180-day MACEs. (C) 1-year MACEs. (D) 5-year MACEs. (E) 1-year all-cause mortality. (F) 5-year all-cause mortality.
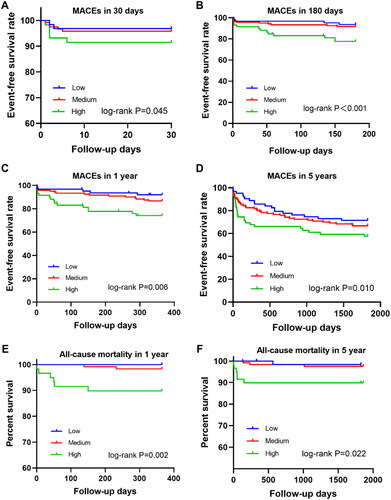
Figure 3. (A) Comparison of plasma PDGF levels between groups based on MACEs. (B) Forest plot shows the HRs with 95% CIs for MACE with regard to age, sex, smoking, hypertension, diabetes, stroke, hyperlipidaemia, previous MI and family history of CHD. (C) Comparison of plasma PDGF levels between groups based on all-cause death. (D) Comparison of plasma PDGF levels between groups based on GRACE score.
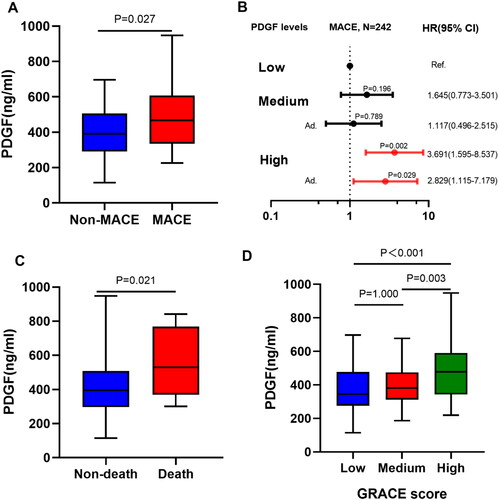
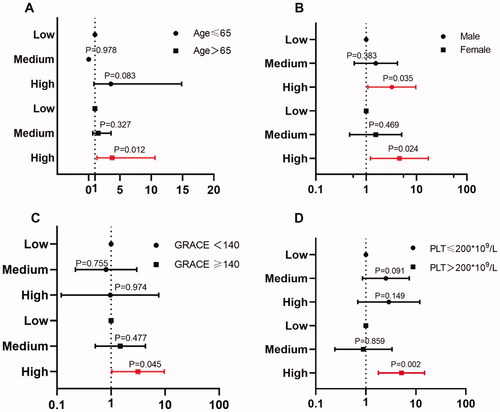
Figure 4. Subgroup analysis of different patients. Panels A–D represent the subgroup analyses stratified by ages, NT-proBNP levels, GRACE score and PLT level.
Supplemental Material
Download JPEG Image (32.6 KB)
Supplemental Material
Download MS Word (18.5 KB)Supplemental Material
Download MS Word (15.9 KB)Data availability statement
All data used and analysed in the study are available by contacting the corresponding authors upon reasonable request.