
Figures & data
Figure 1. IPAT in combination with carboplatin inhibits cell proliferation.
The SPEC-2 and ARK1 cells were treated with different concentrations of IPAT and carboplatin for 72 hours. Cell proliferation was evaluated by MTT assay, as described in Materials and Methods (A). SPEC-2 and ARK1 cells were treated with IPAT (1 uM), carboplatin (10 uM) and the combination treatment for 48 hours, and then the cells continued to culture for 2 weeks, followed by colony assay (B). Combination treatment of IPAT and carboplatin at low doses for 72 hours showed synergic inhibitory effects on cell proliferation in both cell lines. Combination index (CI) was determined using The Bliss Independence model (CI < 1, synergistic effect; CI = 1, additive effect; CI > 1, antagonistic effect). Results represent the median of three separate experiments, each performed in quadruplicate (C). The effects of IPAT, carboplatin and the combination on phosphorylated AKT and phosphorylated S6 were assessed by western blotting (D). * p < 0.05, ** p < 0.01.
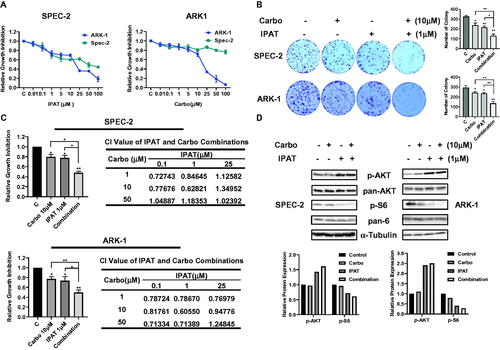
Figure 2. IPAT in combination with carboplatin induces apoptosis.
Cleaved caspase 3 assay was performed on SPEC-2 and ARK1 cells after 14 hours of treatment with IPAT, carboplatin and the combination (A). Western blotting analysis of BCL-XL and MCL-1 was performed on lysates from SPEC-2 and ARK1 cells after 24 hours of treatments. α-Tubulin included as a loading control (B). Values in the bar graphs represent the mean ± SD of at least three independent experiments. * p < 0.05, ** p < 0.01.
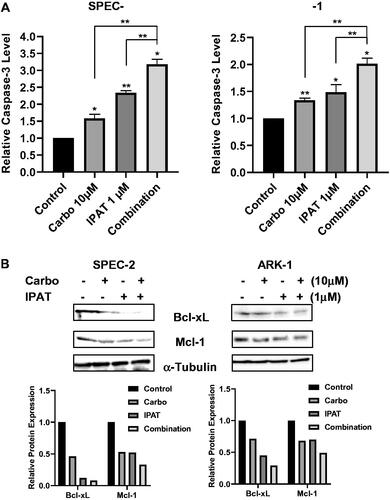
Figure 3. IPAT in combination with carboplatin causes cellular stress.
SPEC-2 and Ark1 cells were treated with IPAT, carboplatin and combination for 16 hours. ROS production was determined by DCFH-DA assay. JC-1 and TMRE were used to detect the mitochondrial membrane potential (A). The expression of cell stress related proteins was measured by western blotting after 24 hours of treatment (B). Data are presented as mean ± SD from three technical replicates. * p < 0.05, ** p < 0.01.
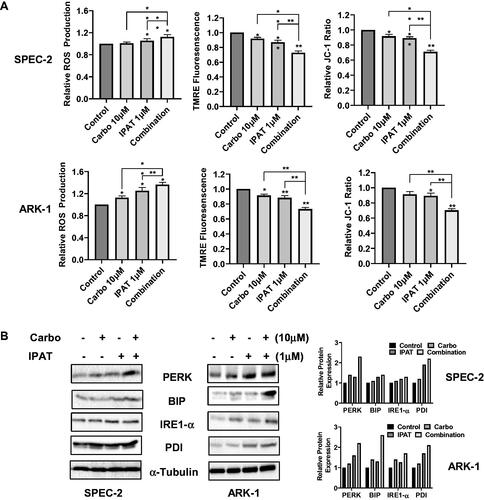
Figure 4. IPAT in combination with carboplatin induces DNA damage.
SPEC-2 and ARK1 cells were treated with 1 uM IPAT, 10 uM carboplatin and their combination for 24 hours. DNA damage markers including geminin, r-H2AX, RAD50 and pCHK2 was detected by western blotting. All images shown here are representative of at least two independent experiments with similar results.
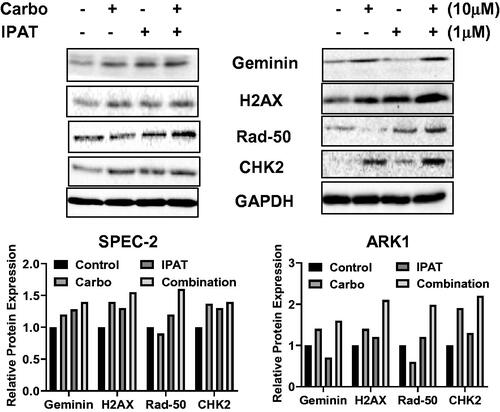
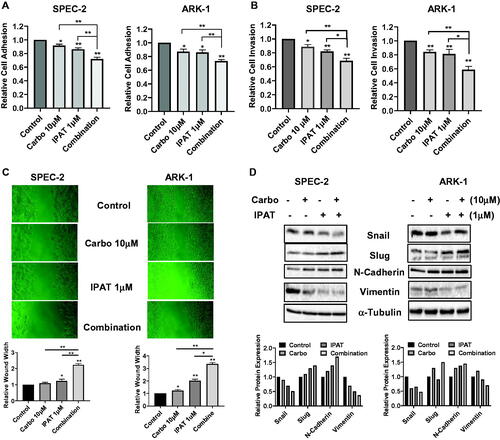
Figure 5. IPAT in combination with carboplatin reduces cell invasion.
SPEC-2 and ARK1 cells were treated with IPAT (1 uM), carboplatin (10 uM) and their combinations for 4 hours, cell adhesion was determined by laminin adhesion assay (A). Invasion was measured using transwell assay and wound healing assay after 24-48 hours of treatment, respectively (B and C). Western blotting for EMT markers including Snail, Slug, N-Cadherin and Vimentin, in SPEC-2 and ARk1 cells, was done after the indicated treatments for 24 hours (D). Results are presented as the mean ± SD of three independent measurements * p < 0.05, ** p < 0.01.
Data availability statement
The raw data supporting the conclusions of this article will be made available by the authors, without undue reservation.