
Figures & data
Table 1. Baseline data distribution of survey population.
Table 2. Comparison of general data in SCH and euthyroid group among PreDM population.
Table 3. Comparison of thyroid-related indicators in SCH and euthyroid group among PreDM population.
Table 4. Comparison of the prevalence of SCH in PreDM and its subtype population.
Figure 1. Distribution of SCH prevalence in different age groups under different glucose metabolism.
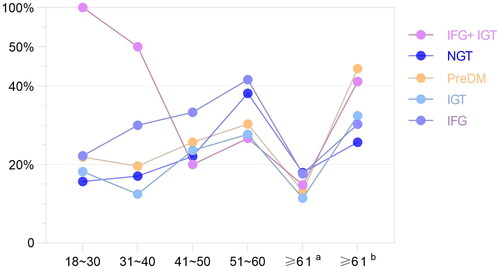
Table 5. SCH prevalence in different age groups under different glucose metabolism.
Figure 2. Thyroid antibodies in different populations.
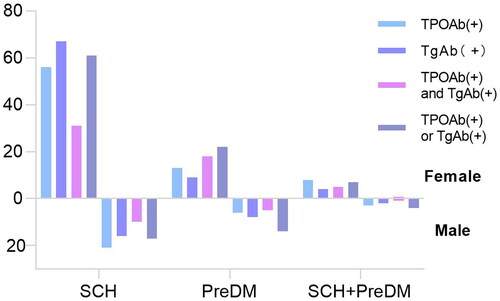
Table 6. Thyroid antibodies in different populations.
Table 7. Logistic regression analysis of SCH risk factors in PreDM and IFG populations.
Data availability statement
The data that support the findings of this study are available from the corresponding author.