
Figures & data
Table 1. Demographic characteristics between groups.
Figure 1. Time-dependent change of inflammatory markers and dry eye metrics. BR: bulbar redness, LR: limbal redness, OSDI: ocular surface disease index, TMH: tear meniscus height, NIBUT-1: noninvasive tear film break-up time first, NIBUT-a: noninvasive tear film break-up time average, FBUT: fluorescein tear film break-up time, CFS: corneal fluorescein staining score using the Oxford scheme; *statistically significant difference from preoperative value, #statistically significant difference between groups.
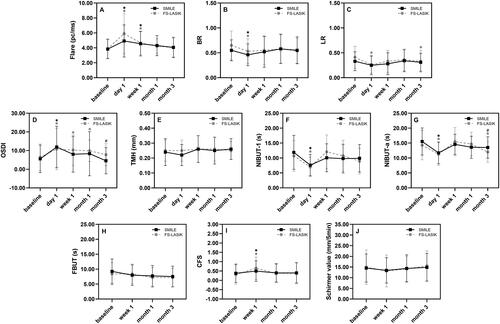
Table 2. Factors correlated with flare during all follow-up time points.
Table 3. Brief summary of flare after laser vision correction.
Supplemental Material
Download MS Word (34.7 KB)Supplemental Material
Download TIFF Image (3.5 MB)Data availability statement
The data that support the findings of this study are available from the corresponding authors (LH & QWG) upon reasonable request.