
Figures & data
Figure 1. Study flowchart.
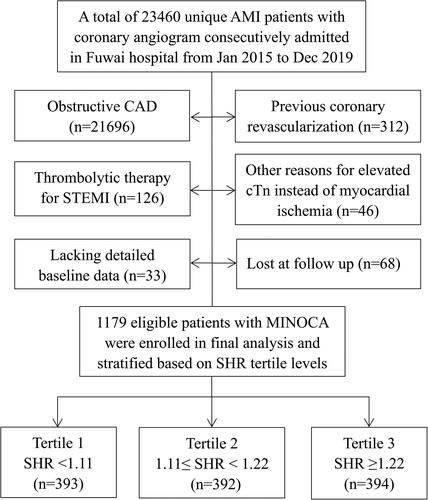
Table 1. Baseline characteristics of MINOCA patients based on SHR tertile levels.
Figure 2. Incidence of the composite event in MINOCA patients across the SHR tertiles. Kaplan–Meier curves showing the cumulative incidence of MACE (A), and the composite hard endpoint of death, nonfatal MI, stroke, or revascularization (B) in patients with tertiles of SHR.
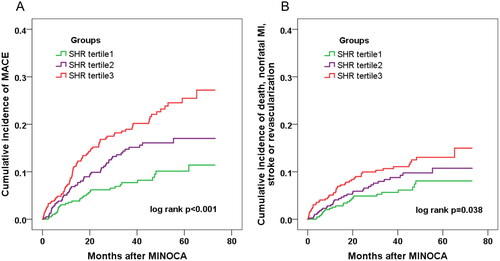
Figure 3. Prognostic value of the ABG or SHR-defined stress hyperglycemia for MACE. Effect of stress hyperglycemia defined by ABG or SHR on MACE risk in overall and in patients with or without diabetes. Hyperglycemia was defined as ABG ≥ 7.8mmol/L, ABG ≥ 11.1mmol/L, or SHR ≥ 1.17. The two cutoff values of ABG were adopted in line with current practice while the cutoff value of SHR was identified with the maximum Youden index for MACE prediction via ROC analysis. HR was adjusted for age, sex, MI type, hypertension, dyslipidemia, LVEF and peak TnI values at multivariable Cox analysis. ABG: admission blood glucose; SHR: stress hyperglycemia ratio; HR: hazard ratio; CI: confidence interval.
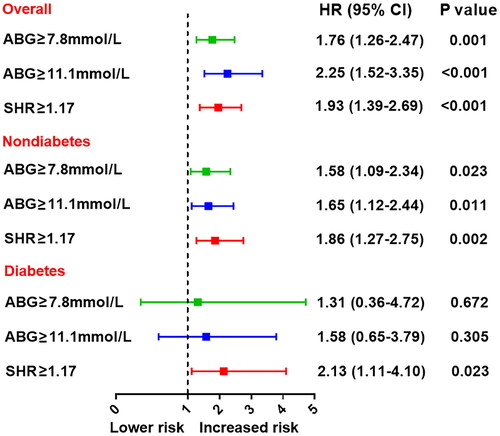
Table 2. Association between SHR levels and the event risk.
Table 3. SHR versus ABG for MACE prediction in patients with or without diabetes.
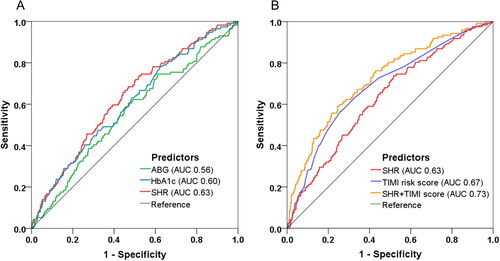
Figure 4. Model improvement in predicting MACE. Receiver operating characteristic (ROC) curves showing discriminatory ability of SHR, FBG, ABG, HbA1c for MACE (A) and the combined model incorporating SHR and TIMI risk score for MACE prediction (B). SHR: stress hyperglycemia ratio; ABG: admission blood glucose; FBG: fasting blood glucose; HbA1c: glycated hemoglobin; TIMI: thrombolysis in myocardial infarction; AUC: area under the curve.
Supplemental Material
Download MS Word (141.6 KB)Data availability statement
The present study was approved by the Ethics Committee of Fuwai hospital (Approval No. 2012-431). Datasets used or analyzed during the current study are available from the corresponding author on reasonable request.