
Figures & data
Figure 1. Flow chart of patient inclusion and exclusion.
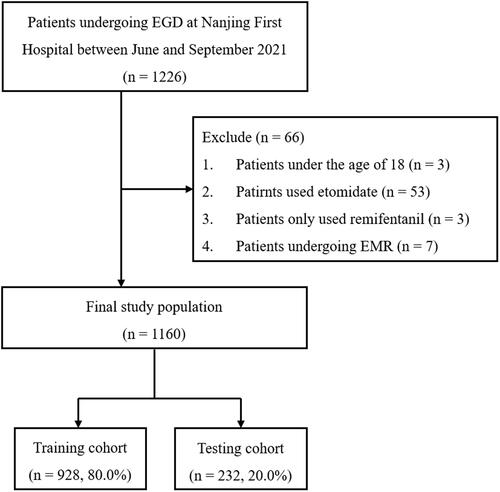
Figure 2. The PRC curve (a) and ROC curve (b) of 4 final models in the internal testing set. AUPRC, the area under the precision-recall curve; AUROC, the area under the receiver operating characteristic curve; LR, logistic regression; SVM, support vector machine; XGBoost, extreme gradient boosting; Type A, the early prediction model of intraoperative hypoxemia; Type B, the late prediction model of intraoperative hypoxemia; Type C, the early prediction model of induction period hypoxemia; Type D, the late prediction model of induction period hypoxemia. The single file for each plot can be found in the figure details of the supplemental materials.
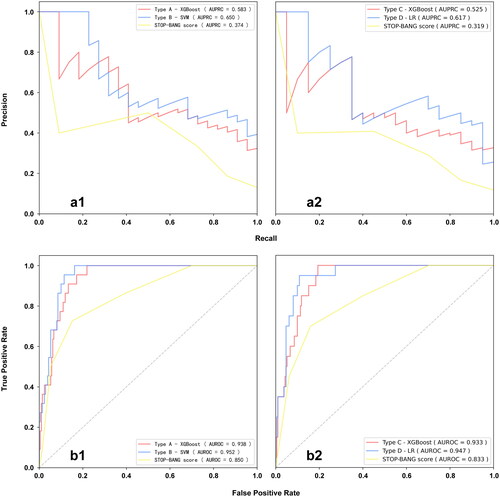
Table 1. The performance of the 4 final models under the optimal threshold in the internal testing set.
Table 2. Comparison of the performance between the prediction model and STOP-BANG score for predicting intraoperative hypoxemia.
Table 3. Comparison of the performance between the prediction model and STOP-BANG score for predicting induction period hypoxemia.
Figure 3. SHAP summary plot of the 4 types of the final model. (1) SHAP bar plot for the ranking of variables’ importance. The sorted result was based on the mean absolute SHAP value of each variable in every Type of final model. (2) SHAP beeswarm plot for the entire distribution of SHAP values for each variable in every Type of final model. Each line represents a variable and each dot represents a case. The redder the color of the dot, the higher the value of the variable for the case. Conversely, the bluer the color of the dot, the lower the value of the variable for the case. The abscissa represents the SHAP value, where a positive value helps the model to predict the case of developing hypoxemia, and vice versa. Type A, the early prediction model of intraoperative hypoxemia; Type B, the late prediction model of intraoperative hypoxemia; Type C, the early prediction model of induction period hypoxemia; Type D, the late prediction model of induction period hypoxemia; ASA, American Society of Anesthesiologists; BMI, Body mass index; GIT, Gastroscopy intubating times; RHSMD, Height-to-sternomental distance; RHTMD, Height-to-thyromental distance; SMD, Sternomental distance; TMD, Thyromental distance; TMH, Thyromental height. The single file for each plot can be found in the figure details of the supplemental materials.
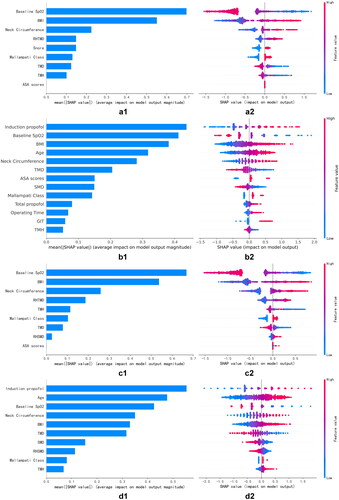
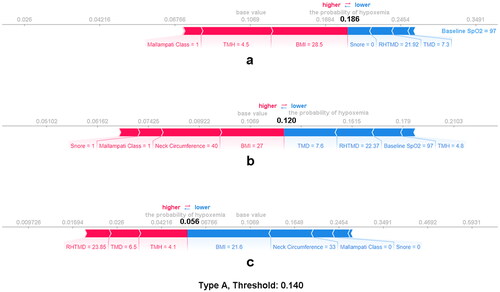
Figure 4. SHAP force plot for individual case explanation on three random patients from the testing cohort of Type A model (SVM). Red represents that the variable increases the chance that the model predicts the patient developing hypoxemia, while blue represents that the variable reduces the chance that the model predicts the patient developing hypoxemia. The figure after the equal sign of the variable name represents the value of the variable (not the value of the SHAP value), and the length of the color bar represents the amount of contribution. (a) true positive case. (b) true negative case. (c) False negative case. Type A, the early prediction model of intraoperative hypoxemia.
Supplemental Material
Download MS Word (24.1 KB)Data availability statement
The data that support the findings of this study are available from the corresponding author, [Yanna Si], upon reasonable request. The related code to the study is available at https://github.com/zdznj/hypoxemia.