
Figures & data
Figure 1. Differential expression and mutation of m1A + m5C + m6A regulatory genes in cervical cancer. (A) Heatmap of MEGs. Green represents down-regulation and red represents up-regulation of the gene. (B) Up-regulated gene mutations Mutation sites for mutations in the mutation frequency. (C) Volcano map of MEGs. Green dots represent 44 down-regulated genes; red dots represent 62 up-regulated genes. (D) 117 of the 142 CESC patients experienced genetic alterations of m6A, m5C, m1A regulators, with a frequency of 82.39%, mostly including amplification, missense mutations, and deep deletions. The number on the right indicated the mutation frequency in each regulator.
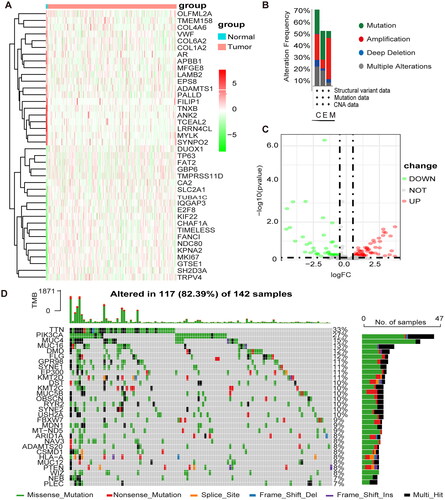
Figure 2. Development of prognostic features of the TCGA-CESC methylation model. (A) Results of univariate cox analysis of OS. (B) Results of multifactorial cox analysis of OS. (C) LASSO coefficient profiles of 10 methylation-associated genes. (D) Heat map of 10 differential gene expressions between high- and low-risk scoring groups. (E) Risk score scatter plot. Red dots indicate dead patients and green dots indicate living patients. (F) Risk score curve graph. Green curves indicate low-risk group and red curves indicate high-risk group.
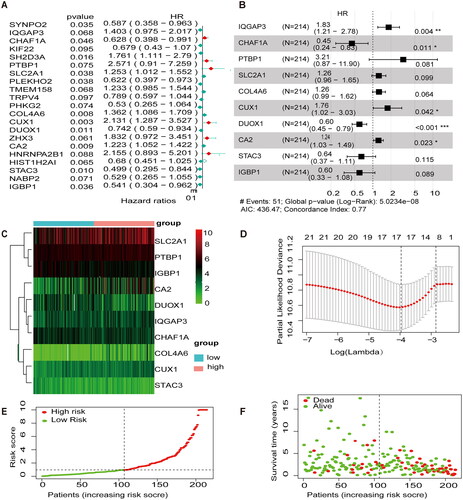
Table 1. Univariate and multivariate COX analysis.
Figure 3. Internal validation of methylation models by TCGA-CESC. (A) Establishing a column line graph based on prognostic features to predict OS in cervical cancer in the TCGA-CESC. (B) Calibration curve for 3-year column line graph prediction. (C) Kaplan–Meier survival curves. Survival time was shorter in the high-risk group in the TCGA-CESC. (D) ROC Curve in the TCGA-CESC.
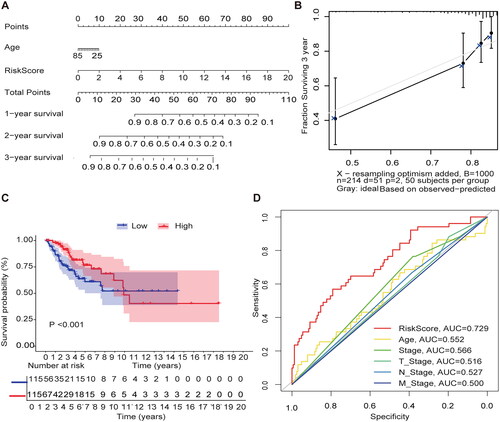
Figure 4. External validation of methylation models by GSE3900. (A) Heat map of 10 differential gene expressions between high- and low-risk scoring groups in GSE39001. (B) Risk score scatter plot. Red dots indicate dead patients and green dots indicate living patients in GSE39001. (C) Risk score curve graph in GSE39001. Green curves indicate low-risk group and red curves indicate the high-risk group. Alive. (D) Establishing a column line graph based on prognostic features to predict OS in cervical cancer in GSE39001.
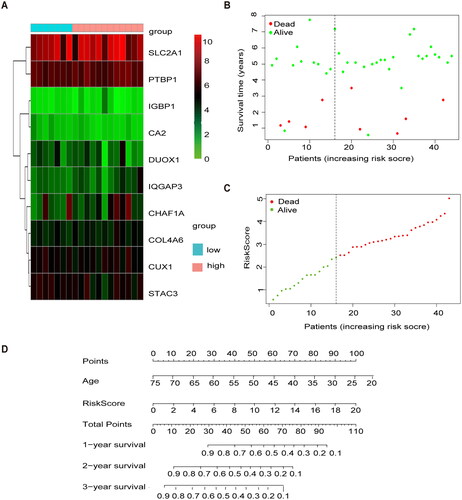
Figure 5. The GO/KEGG/GSEA enrichment analysis on the MEGs (A\C\D\F) Histograms\circles\bubbles\chord plots for en GO/KEGG enrichment analysis. (B) Top 5 GSEA enrichment analyses on the MEGs (E)GSEA enriched gene set in the C2 set, KEGG gene set and NABA gene set.
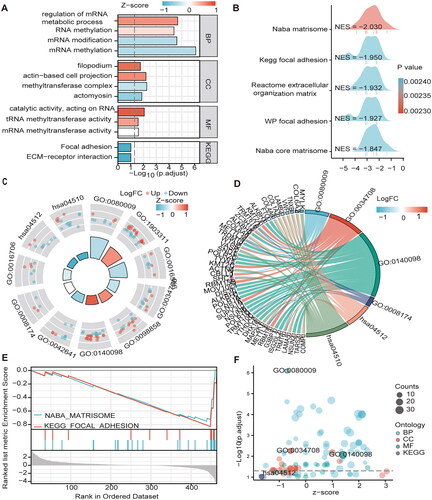
Table 2. GO and KEGG analysis.
Table 3. GSEA analysis.
Figure 6. Gene expression and clinical characteristics based on m6A/m5C/m1A methylation model (A) The model gene expression in high and low-risk groups. (B) All ten regulators were significantly expressed in patients with CESC compared with the normal counterparts, of which seven regulators (SLC2A1, PTBP1, CA2, DUOX1, IQGAP3, CHAF1A, STAC3) were significantly up-regulated, and three regulators (IGBP1, CUX1, COL4A6) were significantly down-regulated. (C) Analysis of Pearson correlation of 10 model genes in CESC. (D) Kaplan–Meier curves for Clinical stage I-II. (E) Kaplan–Meier curves for Clinical stage I-II III-IV. (F) K-M analysis of each high and low mutation group in the model high and low-risk groups.
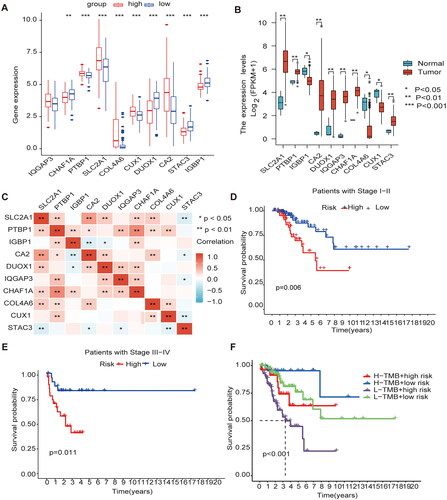
Figure 7. Immune cell infiltration in the m1A + m5C + m6A prognostic model (A) The heat map shows the comparison of immune-related functions in the high and low-risk groups. (B) The expression of immune checkpoint inhibitors (ICIs) in high and low-risk groups. (C) The violin plot shows the distribution of 22 immune cell infiltrates in the high and low-risk groups of the methylation model.
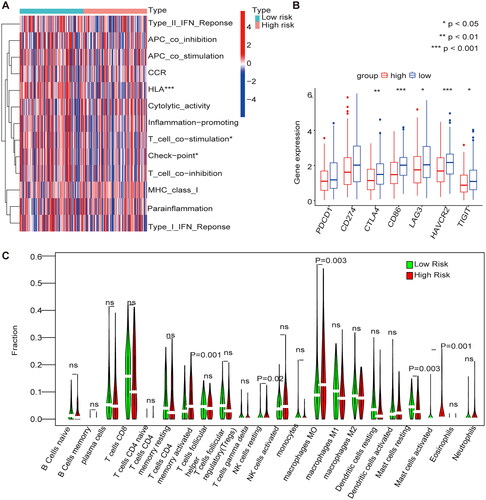
Figure 8. Immunosuppressant treatment response and potentially sensitive drugs (A) IC50 values for anti-CTLA-4 were smaller in the high-risk group, and patients in the high-risk group may be suitable for anti-CTLA-4 therapy (B) The high and low-risk score groups responded to anti-PD-1/PD-L1 and anti-CTLA-4 therapy. (C) Box plot showing differential expression of IC50 for 9 drugs in high and low-risk groups.
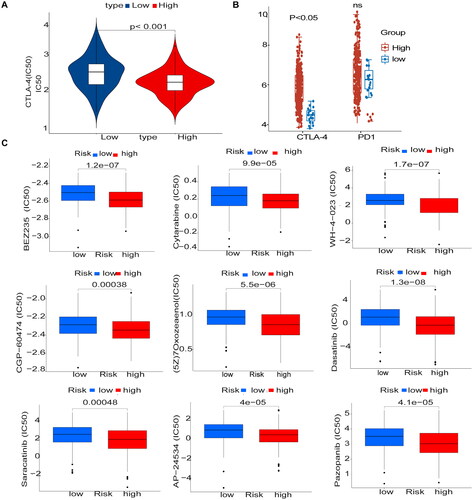
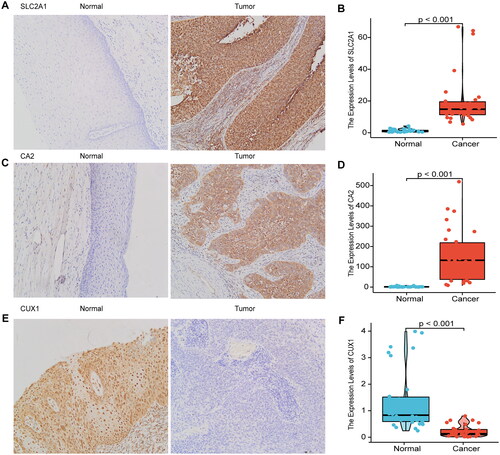
Figure 9. Immunohistochemical validation and RT-qPCR validation of key prognostic genes.
Immunohistochemical results showed that SLC2A1 and CA2 were highly expressed in cervical cancer tissues, and CUX1 was lowly expressed in cervical cancer tissues (A, C, E), RT-qPCR results showed that SLC2A1 and CA2 were highly expressed in cervical cancer tissues, and CUX1 was lowly expressed in cervical cancer (B, D, F).
Supplemental Material
Download TIFF Image (15.8 MB)Supplemental Material
Download TIFF Image (17.6 MB)Supplemental Material
Download MS Word (15.7 KB)Supplemental Material
Download MS Word (15.7 KB)Supplemental Material
Download MS Word (50.1 KB)Data availability statement
All authors confirm that all supporting data, figures, grants, and ethics for this study can be found in the article.