
Figures & data
Figure 1. Paradigm for dietary iron restriction of pregnant mice. (A) Schematic depiction of the experimental timeline. No difference was detected in the (B) weight gain of mothers with an iron-deficient diet (IDD) (48 ppm) and iron-sufficient diet (ISD) (96 ppm) during pregnancy. (C) Litter size, (D) percentage of pups alive, and (E) average weight per pup did not differ between IDD and ISD treated animals on the day of delivery, as well as (F) average weight per pup on postnatal day 7 (P7) (n=38–43/group). All data are presented as mean ± S.E.M. Data were analysed using two-way ANOVA with repeated measures.
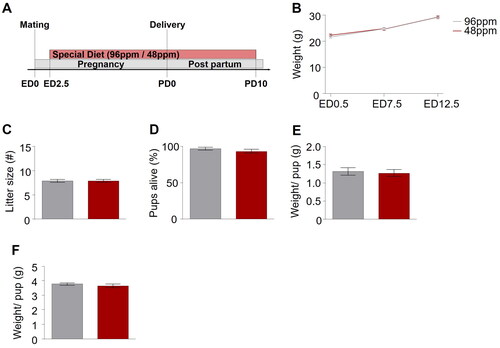
Figure 2. Maternal alimentary iron restriction during pregnancy and lactation reduces the iron content in the pup brain. (A) Representative images of Prussian Blue staining of hippocampal sections of postnatal day 11 (PD11) offspring from mothers provided with iron-deficient diet (IDD) (48 ppm) or iron-sufficient diet (ISD) (96 ppm) during pregnancy and lactation. Scale bars: 200 µm, 10x magnification. (B) Quantification of iron levels in the hippocampus revealed a significant difference between IDD and ISD PD11 offspring (n=6/group). (C) Comparison of NeuN-positive cells per mm2 indicated no difference in the amount of neuronal cells in the hippocampus of ISD and IDD offspring on PD11 (n=6/group). (D) Representative images of hippocampal sections with Prussian Blue staining in adult IDD and ISD offspring. Scale bars: 200 µm, 10x magnification. (E) Quantification showed no difference in hippocampal iron levels between IDD and ISD adult offspring (n=5/group). All data are presented as mean ± S.E.M. Data were analysed using two-way ANOVA with repeated measures; **p < 0.01.
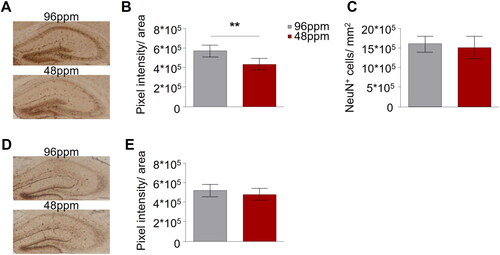
Figure 3. Reduced postnatal spontaneous maternal care behavior upon dietary ID during pregnancy in mice. Percentage of different (A) pup-directed (nursing, licking and grooming, and nest building) and (B) non pup-directed (self-grooming, sleeping, eating, and drinking) behaviours from postnatal day 1 (PD1) to PD6 of mothers provided with iron-deficient diet (IDD) (48 ppm) or iron-sufficient diet (ISD) (96 ppm) (n=8/group). IDD mothers showed significantly reduced licking and grooming behaviour but no other differences between groups were observed. (C) Exemplary depiction of a trace of recorded ultrasonic vocalizations (USVs) recorded from pups on PD4. (D) Mean number and (E) amplitude of USV calls of IDD and ISD pups on PD4 revealed no difference between groups (n=19/group). All data are presented as mean ± S.E.M. Data were analysed using mixed model ANOVA with repeated measures and Student’s t-test where appropriate; *p < 0.05.
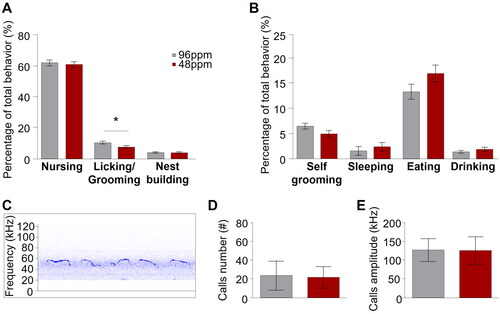
Figure 4. Increased depression-like behaviour in adult mice after early-life ID. Significant differences in behavioural despair in (A) the forced swim test in male and female and (B) the tail suspension test in male offspring from mothers provided with iron-deficient diet (IDD) (48 ppm) compared to iron-sufficient diet (ISD) (96 ppm) during pregnancy and lactation. (C) A significant decrease of time spent in the light compartment of the light/dark box in IDD male mice demonstrates increased anxiety-like behaviour. No differences between groups was found in anhedonic behaviour in the (D) sucrose preference test (percentage of sucrose preference), (E) exploratory activity in the open field test (total distance travelled) and (F) motor coordination in the rotarod (latency to fall off) (n=20–28/group). All data are presented as mean ± S.E.M. Data were analysed using two-way ANOVA; *p < 0.05, **p < 0.005, ***p < 0.001, ****p < 0.0001.
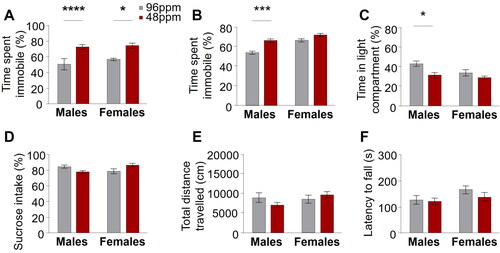
Figure 5. Adult hippocampal neurogenesis is not altered upon after early-life ID. (A) Schematic depiction of the protocol timeline for the administration of BrdU ((+)-5’ Bromo-2’-deoxyuridine). (B) Representative images of BrdU staining in offspring of mothers provided with an iron-deficient diet (IDD) (48 ppm) or iron-sufficient diet (ISD) (96 ppm) during pregnancy and lactation (until postnatal day 10). Scale bars: 200 µm, 20x magnification. (C) Quantification of BrdU+ cells in the hippocampus (n=5–9/group), as well as (D) comparison of NeuN-positive cells per mm2 in hippocampal areas indicated no difference between ISD and IDD animals (n=8/group). All data are presented as mean ± S.E.M. Data were analysed using two-way ANOVA and Student’s t-test where appropriate.
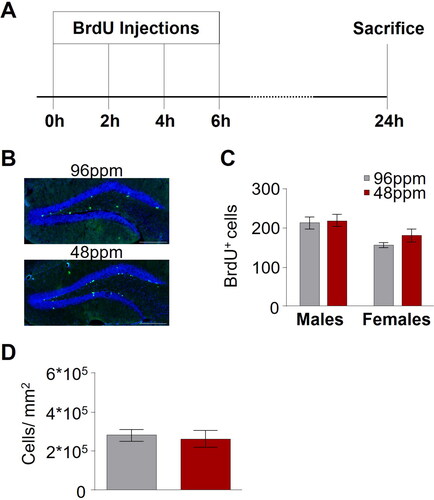
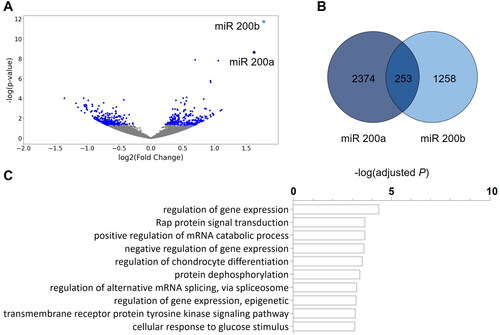
Figure 6. The miRNA expression pattern in the adult hippocampus is modulated by early-life ID. (A) Results of miRNA sequencing in hippocampal tissue of offspring of mothers with an iron-deficient diet (IDD) (48 ppm) and iron-sufficient diet (ISD) (96 ppm) revealed 530 differentially expressed miRNAs (blue dots: q < 0.05). Only two miRNAs, miR 200a and miR 200b, had a log2-fold changes of ≥ + 1.5 or ≤ − 1.5. (B) TargetScanMouse (Version 8.0) revealed 2627 target genes of miR 200a and 1511 target genes of miR 200b. Of these, 253 genes were targeted by both miR 200a and miR 200b, depicted by a Venn diagram (Venny 2.1.0). (C) Results of an enrichment analysis of genes targeted by both miR 200a and miR 200b revealed the involvement in a variety of different biological processes (white bars; Enrichr, GO: Biological processes).
Supplemental Material
Download MS Excel (21 KB)Supplemental Material
Download JPEG Image (425.6 KB)
Data availability statement
The data reported in the findings of this study are available from the corresponding author upon request.