
Figures & data
Figure 1. Conceptual model of study. Populations are represented with round shapes, behaviours/cognitive performance variables represented in rectangular shapes, and the condition (mild cognitive impairment) represented by a triangle. The variables that are the focus of the current investigation, physical activity and fine motor performance, are represented by filled shapes.
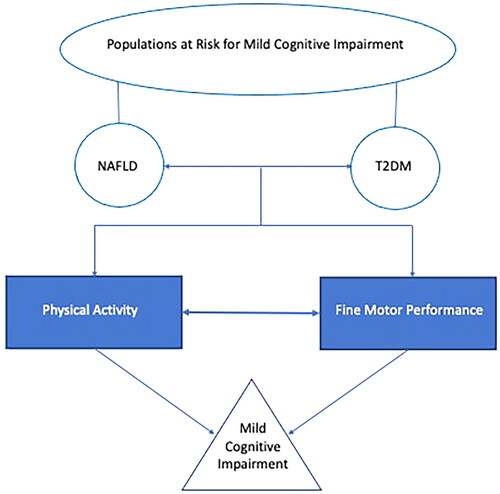
Figure 2. Participant flow diagram.
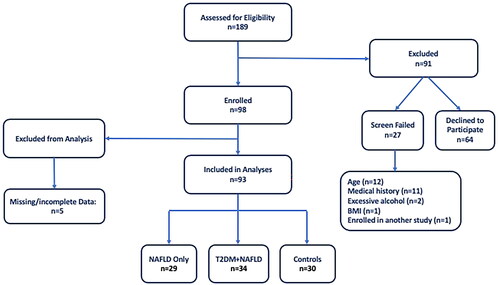
Table 1. Participant characteristics.
Table 2. Motor and physical activity performance by T2DM and NAFLD status.
Figure 3. Relationship between physical activity and fine motor performance. Scatterplot of the Human Activity Profile Adjusted Activity Score and the Grooved Pegboard Test using the non-dominant hand. The three groups are represented by different colour markers and gender is represented by shape of the marker. The fit lines represent each of the group’s correlation (control: r=–0.077; NAFLD: r=–0.380; T2DM + NAFLD: r = 0.094).
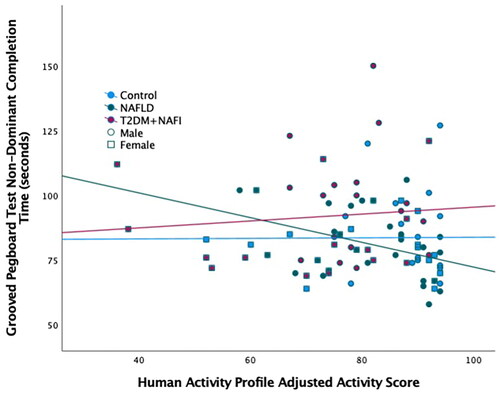
Table 3. Correlation between physical activity and fine motor performance.
Table 4. Partial correlation between physical activity and fine motor performance controlling for body mass index.
Data availability statement
The data from this study are available from author AAW ([email protected]), upon reasonable request.