
Figures & data
Table 1. Clinicopathological data of all patients and healthy subjects included in the study.
Figure 1. Flow diagram showing the study process.
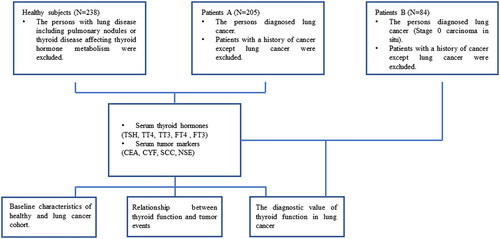
Figure 2. Serum thyroid hormones concentrations in lung cancer patients and their clinical significance. (A) Serum concentration of thyroid stimulating hormone (TSH) in lung cancer patients (n = 205) and healthy subjects (n = 238). (B) Serum concentration of total thyroxine (TT4) in lung cancer patients (n = 205) and healthy subjects (n = 238). (C) Serum concentration of total triiodothyronine (TT3) in lung cancer patients (n = 205) and healthy subjects (n = 238). (D) Serum concentration of free thyroxine (FT4) in lung cancer patients (n = 205) and healthy subjects (n = 238). (E) Serum concentration of free triiodothyronine (FT3) in lung cancer patients (n = 205) and healthy subjects (n = 238). Data are shown as the mean ± SD.
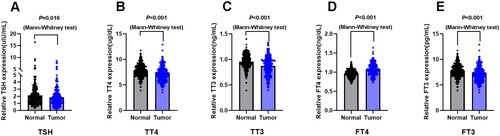
Table 2. Association of serum thyroid hormones levels with clinicopathological parameters of patients A group with lung cancer.
Figure 3. The receiver operating curve (ROC) for the prediction of stage 0 and I–IV lung cancer based on the serum concentration of thyroid hormones and traditional lung cancer markers, using paired healthy subjects as control. (A) ROC curve showing the diagnostic significance of serum thyroid stimulating hormone (TSH) concentration in the lung cancer patients A group. (B) ROC curve showing the diagnostic significance of serum total thyroxine (TT4) concentration in the lung cancer patients A group. (C) ROC curve showing the diagnostic significance of serum total triiodothyronine (TT3) concentration in the lung cancer patients A group. (D) ROC curve showing the diagnostic significance of serum free thyroxine (FT4) level in the lung cancer patients A group. (E) ROC curve showing the diagnostic significance of serum free triiodothyronine (FT3) level in the lung cancer patients A group. (F) ROC curve showed the diagnostic significance of serum carcinoma embryonic antigen (CEA) concentration in the lung cancer patients A group. (G) ROC curve showing the diagnostic significance of serum squamous cell carcinoma (SCC) concentration in the lung cancer patients A group. (H) ROC curve showing the diagnostic significance of serum neuron specific enolase (NSE) concentration in the lung cancer patients A group. (I) ROC curve showing the diagnostic significance of serum CYFRA21-1 (CYF) concentration in the lung cancer patients A group. (J) Comparison of ROC curve showing the diagnostic significance of serum CEA, CYFRA21-1 (CYF) and FT3 concentration in the lung cancer patients A group. (K) Comparison of ROC curve showing the diagnostic significance of serum CEA, CYFRA21-1 (CYF), FT3 and FT3 + CEA + CYF concentration in the lung cancer patients A group. (L) ROC curve showing the diagnostic significance of serum free triiodothyronine (FT3) level in the lung cancer patients B group. (M) ROC curve showing the diagnostic significance of serum free thyroxine (FT4) level in the lung cancer patients B group. (N) ROC curve showed the diagnostic significance of serum carcinoma embryonic antigen (CEA) concentration in the lung cancer patients B group. (O) Comparison of ROC curve showing the diagnostic significance of serum CEA, FT3 and FT4 concentration in the lung cancer patients B group. (P) Comparison of ROC curve showing the diagnostic significance of serum CEA, FT3, FT4 and FT3 + FT4 + CEA concentration in the lung cancer patients B group.
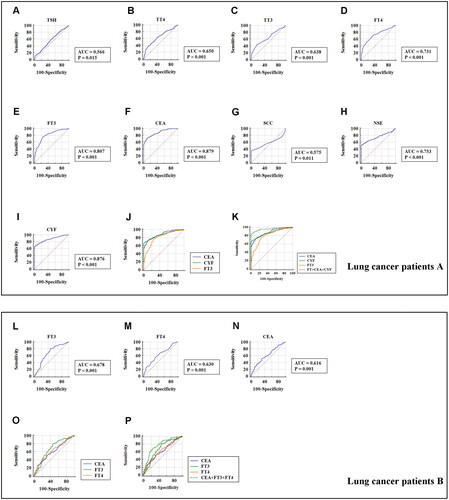
Figure 4. The sensitivity and specificity of markers to differentiate lung cancer patients with different TNM stage from healthy subjects. (A) The sensitivity, specificity and cut-off value of TSH concentration in the lung cancer patients A group. (B) The sensitivity, specificity and cut-off value of TT4 concentration in the lung cancer patients A group. (C) The sensitivity, specificity and cut-off value of TT3 concentration in the lung cancer patients A group. (D) The sensitivity, specificity and cut-off value of FT4 concentration in the lung cancer patients A group. (E) The sensitivity, specificity and cut-off value of FT3 concentration in the lung cancer patients A group. (F) The sensitivity, specificity and cut-off value of CEA concentration in the lung cancer patients A group. (G) The sensitivity, specificity and cut-off value of SCC concentration in the lung cancer patients A group. (H) The sensitivity, specificity and cut-off value of NSE concentration in the lung cancer patients A group. (I) The sensitivity, specificity and cut-off value of CYF concentration in the lung cancer patients A group. (J) The sensitivity, specificity and cut-off value of FT3 concentration in the lung cancer patients B group. (K) The sensitivity, specificity and cut-off value of FT4 concentration in the lung cancer patients B group. (L) The sensitivity, specificity and cut-off value of CEA concentration in the lung cancer patients B group.
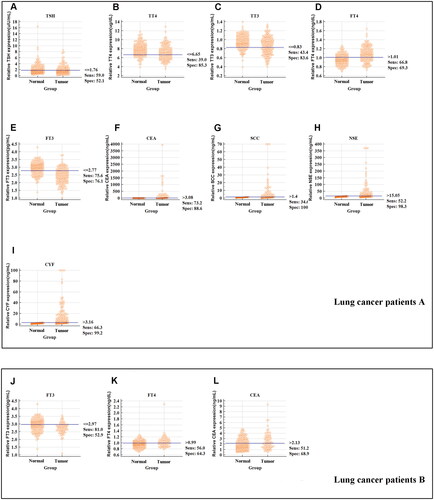
Table 3. The assessment of a biomarker role of the thyroid hormones and traditional lung cancer markers in lung cancer.
Data availability statement
Original data will be provided upon request after removal of personal identifiers.