
Figures & data
Figure 1. The visual flow-process diagram of this study.
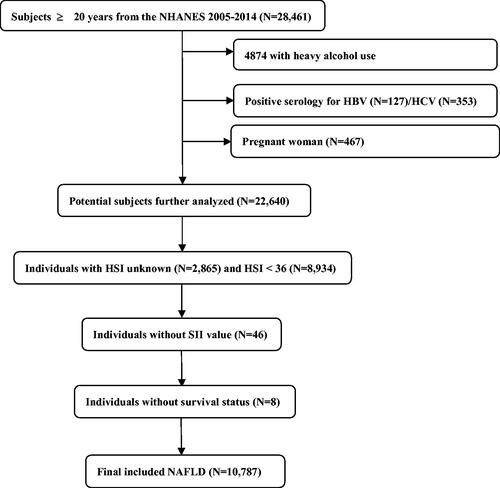
Table 1. Baseline characteristics of NAFLD individuals according to systemic immune-inflammation index quartiles, weighted.
Figure 2. Cox cumulative hazard function for all-cause death stratified by log2-SII quartiles. Participants with the highest concentrations of log2-SII (quartile 4) exhibited remarkably worse outcome compared to individuals with lower log2-SII concentrations.
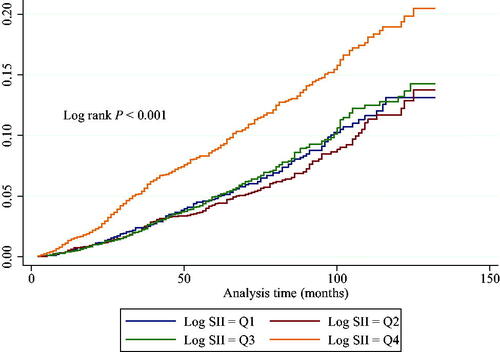
Table 2. Associations of the SII with all-cause mortality in individuals with NAFLD.
Figure 3. Relationship between log2-SII and all-cause mortality by smooth curve fitting. Adjustment for age, sex, race, BMI, waist circumference, marital status, education, smoking and family poverty income ratio, asthma, cancer, diabetes; hypertension, smoking, creatinine, cholesterol, ALT, AST, HbA1c, HDL and creatinine. The red line demonstrates the risk of mortality, and the blue dotted lines illustrate its 95% confidence interval.
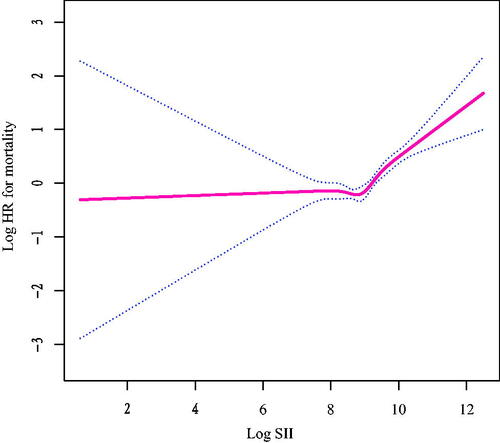
Table 3. Threshold analysis for the relationship between log2-SII and all-cause mortality in patients with NAFLD.
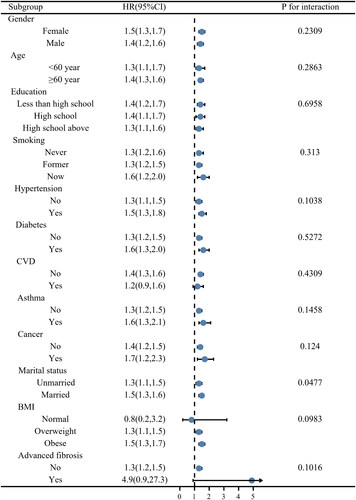
Figure 4. Stratification analysis of log2-SII with all-cause mortality in NAFLD.
Supplemental Material
Download PDF (58.1 KB)Supplemental Material
Download PDF (7 KB)Supplemental Material
Download MS Word (17.5 KB)Data availability statement
A publicly available dataset was analyzed in this study. The National Health and Nutrition Examination Survey dataset is publicly available at https://www.cdc.gov/nchs/nhanes/index.htm.