
Figures & data
Table 1. Comparisons of clinical characteristics between the early-recurrence group and the not early-recurrence group before and after matching.
Figure 1. Recurrence-free survival (RFS) of hepatocellular carcinoma patients after hepatic resection (HR) alone or with postoperative adjuvant transarterial chemoembolization (PA-TACE): comparison of RFS (A) among total patients (n = 749), (B) in the matched Early recurrence group (n = 170), (C) in the matched Not early recurrence group (n = 170). The log-rank test was used to determine significant differences between Kaplan–Meier curves.
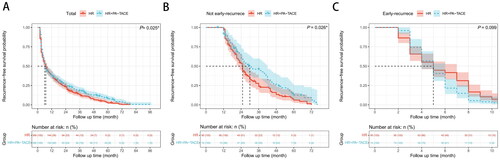
Table 2. Comparisons of clinical characteristics between the development cohort and the validation cohort.
Figure 2. (A) Univariable and (B) multivariable analyses of associations in PA-TACE-insensitive of hepatocellular carcinoma. (C) Postoperative nomogram for predicting the PA-TACE-insensitive of hepatocellular carcinoma. Calibration curve for predicting PA-TACE-insensitive in the (D) development cohort and (E) validation cohort. Receiver operating characteristic curve of the postoperative nomogram in (F) the development cohort and (G) the validation cohort. AUC, Area under the curve. The cutoff value was determined by ROC curve. DCA of the PA-TACE- insensitive nomogram in (H) the development cohort and (I) the validation cohort. The X axis shows the high-risk threshold, and the Y axis represents the standardized net benefit. Clinical impact curves of the PA-TACE-insensitive nomogram in (J) the development cohort and (K) the validation cohort. The number of high-risk patients (blue dotted line) and the number of high-risk patients with events (red solid line) are plotted.
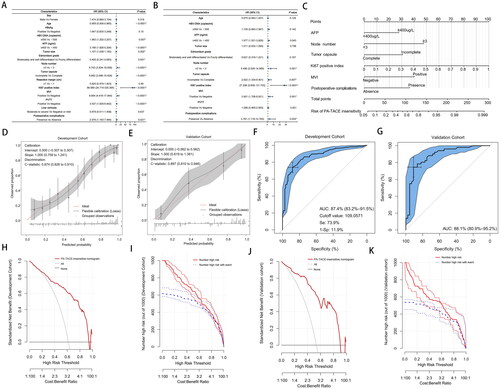
Figure 3. (A) Possibility of PA-TACE-insensitive, (B) recurrence-free survival (RFS), and (C) overall survival (OS) between the low score group and the high score group in the development cohort. (D) Possibility of PA-TACE-insensitive, (E) recurrence-free survival (RFS), and (F) overall survival (OS) between the low score group and the high score group in the validation cohort. The log-rank test was used to determine significant differences between Kaplan–Meier curves.
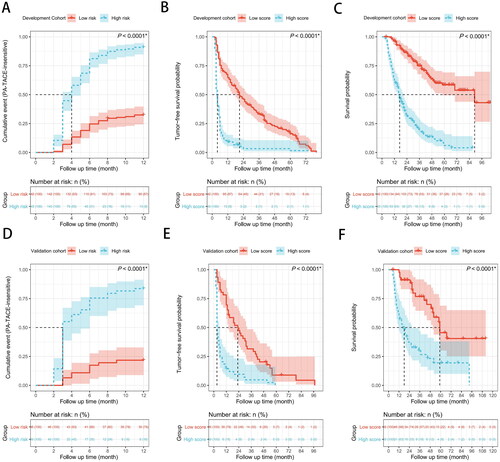
Figure 4. Possibility of PA-TACE-insensitive, recurrence-free survival (RFS) and overall survival (OS) of hepatocellular carcinoma patients after hepatic resection (HR) alone or with postoperative adjuvant transarterial chemoembolization (PA-TACE) among total 749 patients: comparison of possibility of PA-TACE-insensitive, RFS, or OS (A–C) in the low score group (n = 338), (D–F) in the high score group (n = 411). The log-rank test was used to determine significant differences between Kaplan–Meier curves.
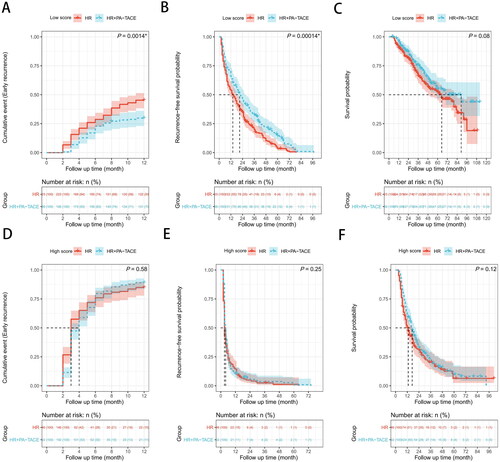
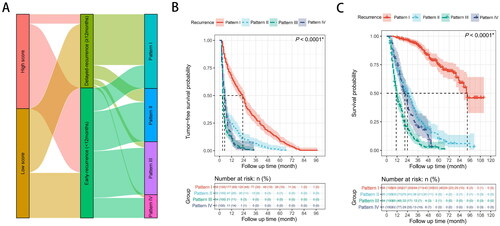
Figure 5. (A) Characteristic association and outcome flow of relapsed patients. (B,C) Recurrence-free survival (RFS) or overall survival (OS) of relapsed patients (n = 708): comparison of RFS (B) or OS (C) in four groups. The log-rank test was used to determine significant differences between Kaplan–Meier curves. Pattern I: solitary-intrahepatic recurrence; Pattern II: multi-intrahepatic recurrence; Pattern III: intrahepatic recurrence with vascular invasion and/or extrahepatic recurrence; Pattern IV: extrahepatic recurrence alone.
Data availability statement
The data that support the findings of this study are available from the corresponding author upon reasonable request.