
Figures & data
Table 1. Baseline demographic and clinical factors compared between SCCA with and without recurrence.
Figure 1. Transcriptional landscape of recurrent anal cancer. (A) Principle component analysis (PCA) of counts matrix corresponding to all non-recurrent or recurrent anal cancer isolates colored by group and clustered by top 2 principle components accounting for 16 and 19% of total variance. (B) Bar graph of number of total differentially expressed genes (DEGs) identified as upregulated and significantly different (p < 0.05) in either recurrent or non-recurrent isolates as mRNA, miRNA, lnc/lincRNA, snRNA, or snoRNA. All mRNA DEGs are represented as a (C) volcano plot while ncRNAs such as (D) miRNAs, (E) lnc/lincRNAs, and (F) snRNA/snoRNAs are represented as heatmaps. Only those mRNA DEGs which were identified as significantly different between groups by a FDR < 0.05 were highlighted in purple in (C).
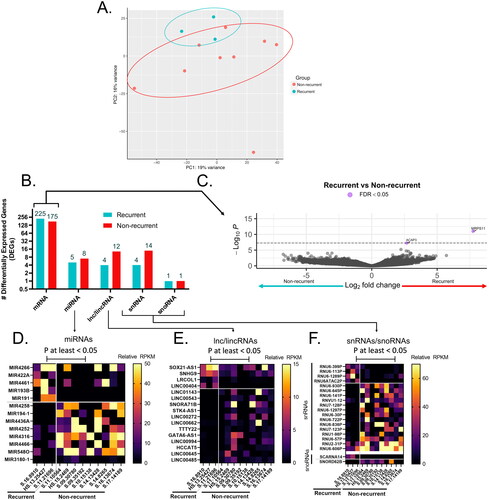
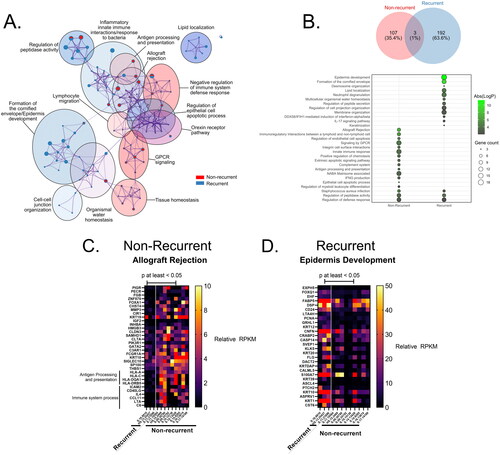
Figure 2. Gene ontology (GO) enrichment for DEGs upregulated in recurrent or non-recurrent anal cancer isolates. (A) Metascape enrichment bubblemap of GO terms describing DEGs in each group, with relative number of DEGs from each group contributing to each term/node represented as individual pie charts, colored by membership. (B) Number of GO terms for DEGs in each group represented as venn diagram and most relevant biological processes represented as a bubbleplot colored by Abs(log(p-value)) and size constrained by number of DEGs contributing to term and ordered by Abs(logP). Representative heatmaps of DEGs contributing to the GO terms with the highest enrichment score for each group are shown for (C) Non-recurrent (Allograft Rejection) and (D) recurrent groups (Epidermis Development), colored by reads per kilobase exon per million mapped reads (RPKM) expression value for each DEG.
Data availability statement
The data that support the findings of this study are available from the corresponding author SS, upon reasonable request.