Figures & data
Figure 1. Construction of risk score model.
A: prognosis-related gene identified by univariate Cox analysis. B: LASSO coefficient profiles of 23 candidate genes. C: screening of the best parameter (lambda) in the LASSO model. D: regression coefficients for 10 DDR-related signature genes. E–H, Kaplan-Meier survival analysis of EID3, MGMT, NUD1 and PMS1in the high- and low-risk score groups.
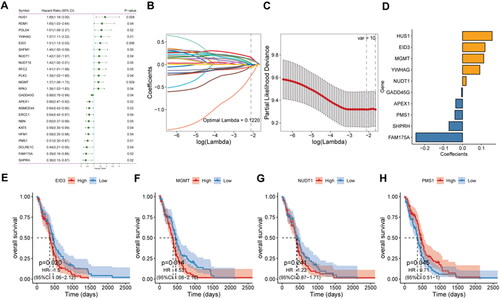
Figure 2. RT-qPCR validation of DDR-related signature genes.
*P < 0.05; **P < 0.01. N: normal controls; CA: cancer.
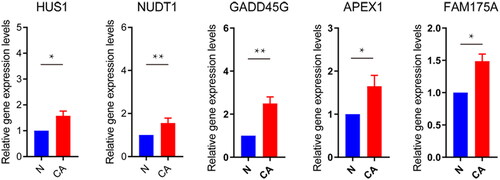
Figure 3. Protein expression of DDR-related signature genes.
***P < 0.001.
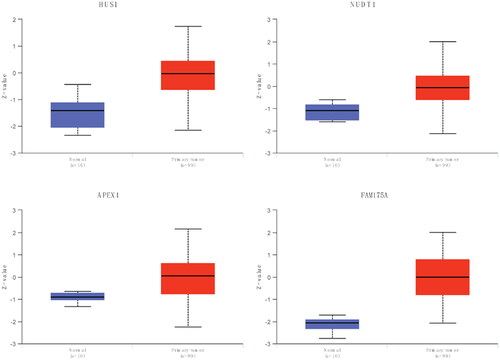
Figure 4. Efficiency assessment of risk score model.
A: distribution of the risk score for each sample in the TCGA cohort. B: survival of each patient. C, expression heat map of DDR-related signature genes in different risk sore groups. D: Kaplan-Meier survival analysis in each sample. E: time-dependent ROC analysis.
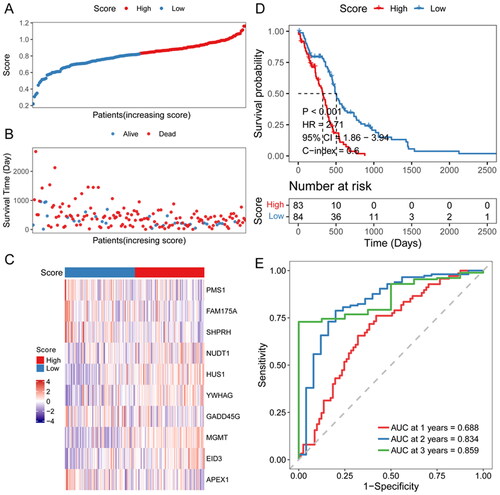
Figure 5. Effectiveness evaluation of risk score in different cohorts.
A–B, Kaplan-Meier survival and time-dependent ROC analysis in the mRNA-array_301 cohort. C-D, Kaplan-Meier survival and time-dependent ROC analysis in the mRNA-array_325 cohort. E–F, Kaplan-Meier survival and time-dependent ROC analysis in the mRNA-array_693 cohort.
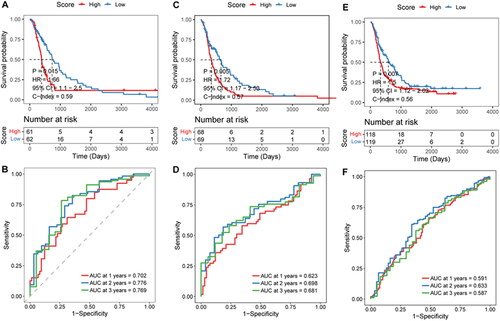
Figure 6. Independent prognostic value of the risk score.
A: univariate Cox analysis. B: multivariate Cox analysis.
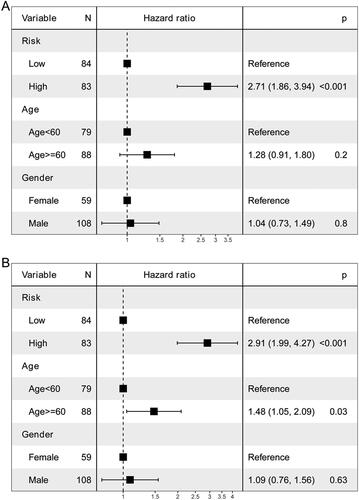
Figure 7. Prognostic efficacy of the risk score model in different clinical subgroups.
A–B, Kaplan-Meier survival analysis in age subgroup. C–D, Kaplan-Meier survival analysis in sex subgroup.
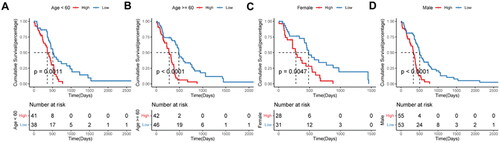
Figure 8. Relationship analysis of risk score and TMB.
A, the distribution ratio of the risk score in different TMB score groups. B, distribution of TMB score in different risk score groups. C, Kaplan-Meier survival analysis in different TMB scores groups. D–E, gene mutation waterfall charts in the low-risk score and high-risk score groups.
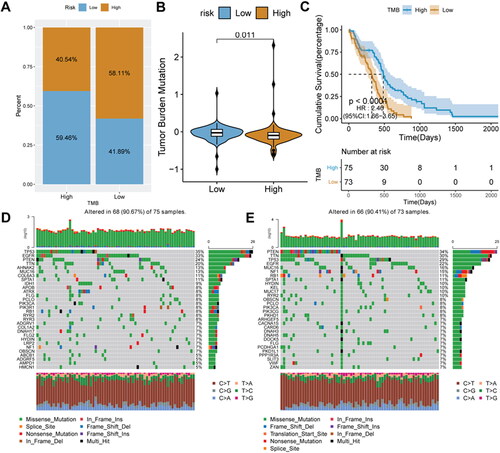
Figure 9. Relationship analysis of risk score and immune cell infiltration.
A, box plot of immune cell infiltration between high-and low-risk score groups; B: difference in immune score between high-and low-risk score groups. C, difference in ESTIMATE score between high-and low-risk score groups. D, difference in stromal score between high-and low-risk score groups. E, difference in tumor purity between high-and low-risk score groups. F, GSVA analysis of differentially expressed pathways.
*P < 0.05; **P < 0.01; ns: not significant.
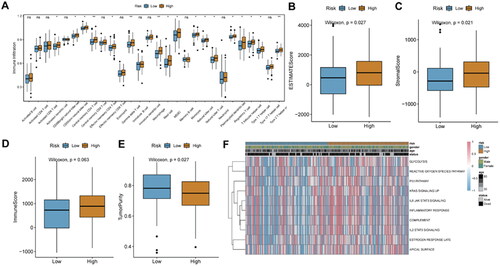
Figure 10. Prediction of immunotherapy response in the IMvigor 210 cohort.
A, Kaplan-Meier survival analysis between high- and low-risk score groups. B, histogram of immunotherapy response ratios between high- and low-risk score groups in the IMvigor210 cohort. C, differences in risk scores according to the efficacy of immunotherapy. D, immune cell infiltration between high- and low-risk score groups. E, correlation between risk score and immune cells.
**p < 0.01; ns: not significant.
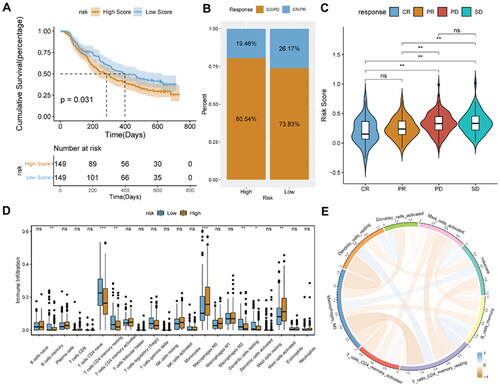
Figure 11. Relationship analysis of risk score and drug sensitivity.
A, spearman correlation between drug IC50 and risk score. B, difference in drug IC50 values between high- and low-risk score groups. *p < 0.05; **p < 0.01; ****p < 0.0001.
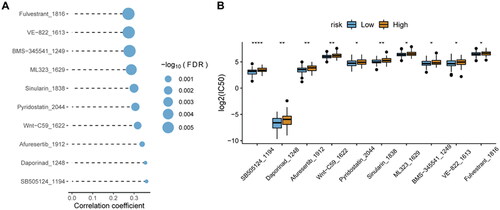
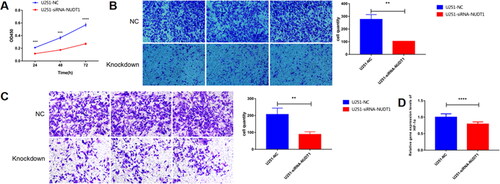
Figure 12. The effect of NUDT1 on cell proliferation, migration and invasion.
In view of analysis results and related literature reports, one of DDR related gene, NUDT1, was used for further molecular mechanism analysis. From the CCK-8 experiment, we found that NUDT1 promoted tumor cell proliferation.
A, the effect of NUDT1 on cell proliferation. B, the effect of NUDT1 on cell migration. C, the effect of NUDT1 on cell invasion. D, the effect of NUDT1 on mRNA expression of HIF-1α.
**p < 0.01; ***p < 0.001; ****p < 0.0001.