
Figures & data
Figure 1. Identifification of two molecular subtypes base on inflammatory-related genes in NSCLC. (A) Molecular subtype discrimination of NSCLC patients base on inflammatory-related genes. (B) Clinical features comparison between the two clusters. (C–E) Prognostic value comparison between the two clusters in the NSCLS patients, include Overall survival, progression free survival and disease free survival.
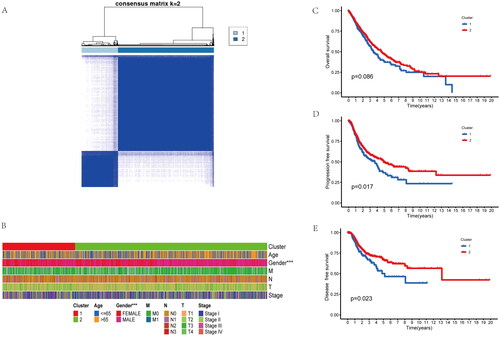
Figure 2. Enrichment analysis of the differences between the two clusters. (A) the GO (Gene Ontology) analysis base on the different genes of the two clusters, included biological process (BP), cell component (CP), and molecular function (MF). (B) KEGG (Kyoto Encyclopedia of Genes and Genomes) analysis base on the different genes of the two clusters. (C) Immune infiltration analysis with the CIBERSORT of the two clusters.
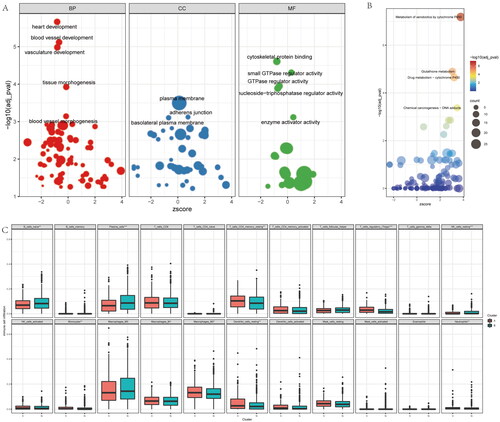
Figure 3. Identify difference expression and prognostic genes analysis between the two groups. (A) volcano map for Identification of difference expression genes of the two clusters. (B) the Venn diagram of difference expressed genes and prognostic genes for screen risk genes base on inflammatory-related genes. (C,D) By multivariate analysis of 95 differential genes, 8 independent differential genes were selected and included in the random forest prognosis model.
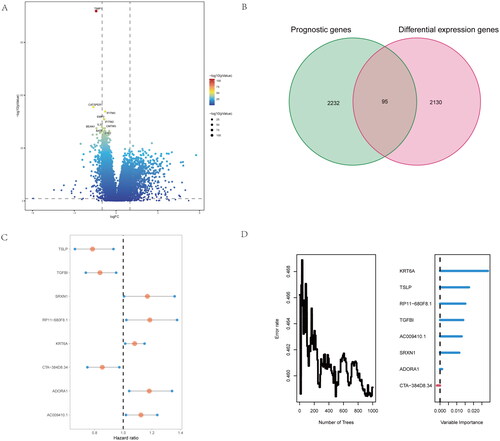
Figure 4. Development of risk-score based on the 8 inflammatory-related gene signature of NSCLC patients with the training cohort and the validation cohort. (A) ROC curve for 1, 3 and 5 years overall survival of the training cohort in NSCLC patients. (B) ROC curve for 1, 3 and 5 years overall survival of the validation cohort in NSCLC patients. (D) Kaplan–Meier survival plot showing overall survival using risk score of inflammatory-related gene signature in NSCLC training cohort. (E) Kaplan–Meier survival plot showing overall survival using risk score of inflammatory-related gene signature in NSCLC validation cohort. (F,G) Continuous AUC curve of 3-year in the training and validation cohort.
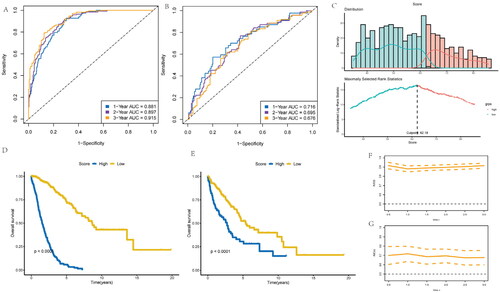
Figure 5. Construction and calibration of nomogram for prognostic prediction in NSCLC patients base on inflammatory-related gene signature. (A,B) Univariate and multivariate analysis on the risk score in NSCLC patients. (C) Nomogram based on the inflammatory-related gene signature NSCLC patients. (D) ROC curve of the Nomogram for 1, 3 and 5 years overall survival in the validation cohort in NSCLC patients. (E) Calibration curve of the nomogram at 1 year, 3 years and 5 years.
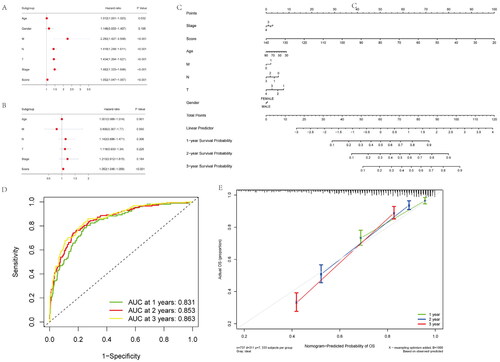
Figure 6. Functional, chemotherapy and immune infiltration analysis between different inflammatory-related gene signature. (A) Gene set variation analysis (GSVA) analysis is performed on patients with high and low scores. (B) The difference between response and non-response scores of NSCLC patients with chemotherapy in TCGA data. (C) Cibersort immune function analysis between the two groups. (D) correlation between immune marker and score.
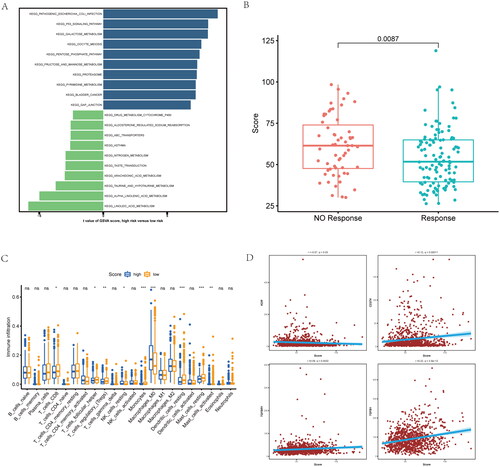
Figure 7. Inflammatory-related gene signature for predicting sensitive chemotherapy drugs and the effect of immunotherapy. (A) OncoPredict package was used to predict sensitive chemotherapy drugs. (B) The likelihood of the clinical response to anti-PD1 therapy for high and low riskscore patients from the TCGA cohorts. True represents immunotherapy responders, while false represents immunotherapy nonresponders. (C–E) The violin plots present of TIDE value, immune dysfunction and immune exclusion in high and low riskscore groups.
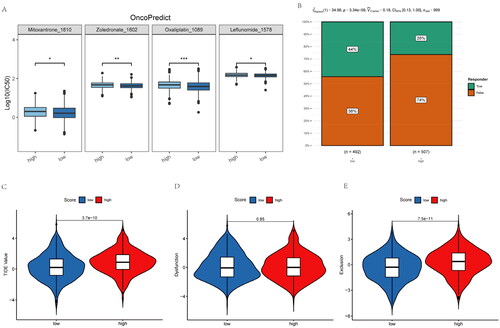
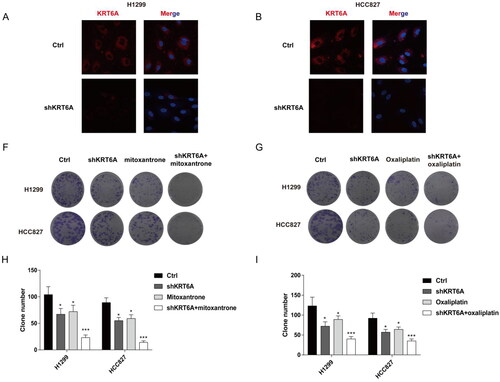
Figure 8. Targeting KRT6A enhance sensitivity of mitoxantrone and oxaliplatin in H1299 and HCC827 cells. (A) Immunofluorescence was used to detect the KRT6A expression after knockdown in H1299 and HCC827 cells. (B,C) Colony forming ability were detected when KRT6A knockdown combined with treatment with mitoxantrone (20 nM) or oxaliplatin (10 μM) in H1299 and HCC827 cells. (D,E) Statistical analysis were performed when KRT6A knockdown combined with treatment with mitoxantrone or oxaliplatin in H1299 and HCC827 cells. (*: vs control group, p < .05).
Supplemental Material
Download MS Word (21.8 KB)Data availability statement
Data utilized in the present work can be obtained from corresponding author on request.