
Figures & data
Table 1. Age-standardized SEV rates of occupational carcinogens risks related to TBL cancer and average annual percentage change.
Figure 1. The change trends of age-standardized SEV rate for TBL cancer among sexes and risk factors from 1990 to 2019. (A) age-standardized SEV rate for both genders; (B) age-standardized SEV rate for male; (C) age-standardized SEV rate for female.
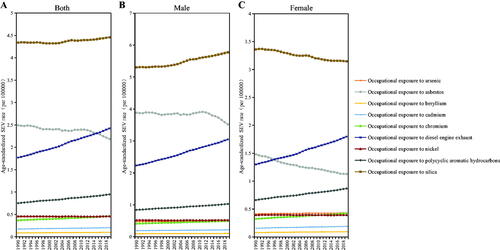
Table 2. The death, DALYs, ASRs and their change trends of TBL cancer attributable to occupational carcinogens from 1990 to 2019.
Figure 2. The ASDR and age-standardized DALYs rate trends of TBL cancer from 1990 to 2019 in global and 5 SDI categories regions. (A) APPC of ASDR in global; (B) APPC of ASDR in high SDI regions; (C) APPC of ASDR in high-middle SDI regions; (D) APPC of ASDR in middle SDI regions; (E) APPC of ASDR in low-middle SDI regions; (F) APPC of ASDR in low SDI regions; (G) APPC of age-standardized DALYs rate in global; (H) APPC of age-standardized DALYs rate in high SDI regions; (I) APPC of age-standardized DALYs rate in high-middle SDI regions; (J) APPC of age-standardized DALYs rate in middle SDI regions; (K) APPC of age-standardized DALYs rate in low-middle SDI regions; (L) APPC of age-standardized DALYs rate in low SDI regions.
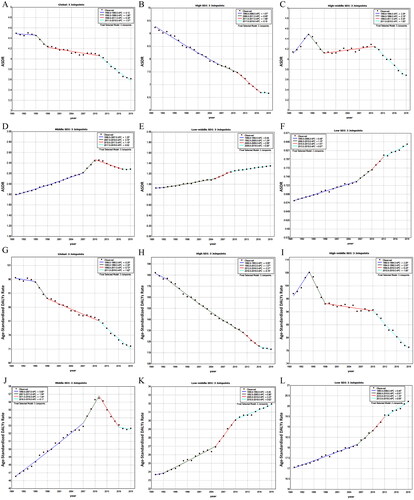
Figure 3. The spatial distribution of ASDR and age-standardized DALYs rate in TBL cancer attributable to occupational carcinogens in 2019, and their AAPC among 204 countries and territories. (A) ASDR in 2019; (B) Age-standardized DALYs rate in 2019; (C)AAPC of ASDR; (D) AAPC of age-standardized DALYs rate.
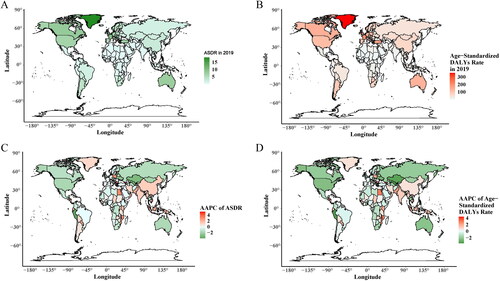
Figure 4. Contribution of different ages in deaths and DALYs of TBL cancer attributable to occupational carcinogens by sex among regions in 2019.
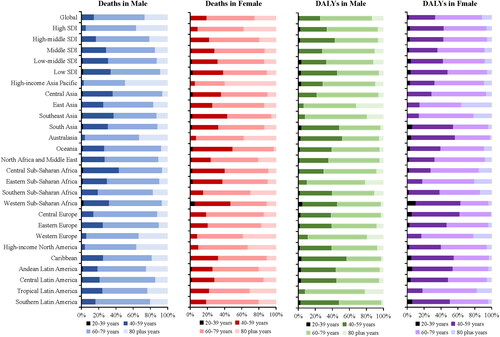
Figure 5. The ASRs of occupational carcinogens attributable TBL cancer among 21 regions based on SDI from 1990 to 2019. The vertical axis is the age-standardized deaths and DALYs rate, and the horizontal axis is the SDI value. Each combination of colors and shapes represents a region. Each point represents the age-standardized death and DALYs rate that year in each region. Each combination of the same color and shape, from front to back, represents the data for each year from 1990 to 2019. (A) ASDR for both genders; (B) age-standardized DALYs rate for both genders; (C) ASDR for male; (D) age-standardized DALYs rate for male; (E) ASDR for female; and (F) age-standardized DALYs rate for female.
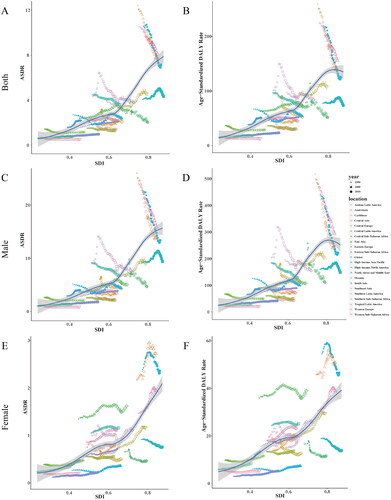
Figure 6. The ratio trends of male to female in ASDR and age-standardized DALYs rate of TBL cancer attributable to occupational carcinogens from 1990 to 2019. (A) The trends of male in ASDR of TBL cancer attributable to occupational carcinogens from 1990 to 2019; (B) The trends of female in ASDR of TBL cancer attributable to occupational carcinogens from 1990 to 2019; (C) The ratio trends of male to female in ASDR of TBL cancer attributable to occupational carcinogens from 1990 to 2019; (D) The trends of male in age-standardized DALYs rate of TBL cancer attributable to occupational carcinogens from 1990 to 2019; (E) The trends of female in age-standardized DALYs rate of TBL cancer attributable to occupational carcinogens from 1990 to 2019; (F) The ratio trends of male to female in age-standardized DALYs rate of TBL cancer attributable to occupational carcinogens from 1990 to 2019.
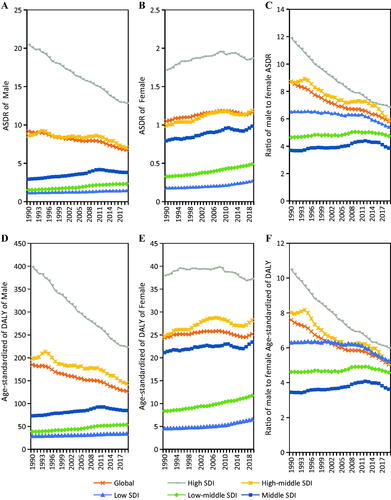
Figure 7. The age-period-cohort analysis of the mortality rate of TBL cancer attributable to occupational carcinogens from 1990 to 2019. (A) The age effect; (B) The period effect; (C) The cohort effect.
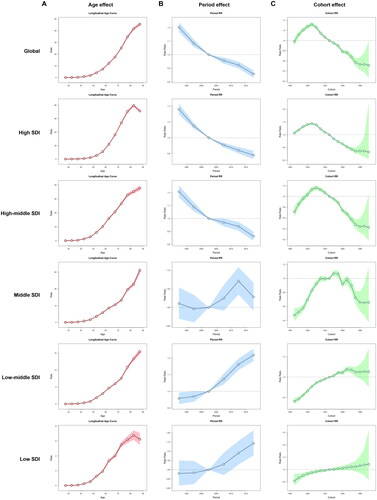
Figure 8. The age-period-cohort analysis of the DALYs rate of TBL cancer attributable to occupational carcinogens from 1990 to 2019. (A) The age effect; (B) The period effect; (C) The cohort effect.
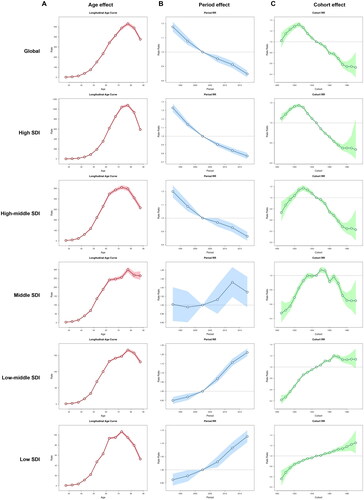
Figure 9. The ASDR and age-standardized DALYs rate trends of TBL cancer attributable to different occupational carcinogens by genders from 1990 to 2019. (A) ASDR trends in both genders; (B) ASDR trends in male; (C) ASDR trends in female; (D) Age-standardized DALYs rate trends in both genders; (E) Age-standardized DALYs rate trends in male; (F) Age-standardized DALYs rate trends in female.
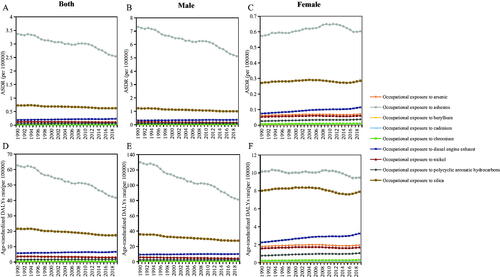
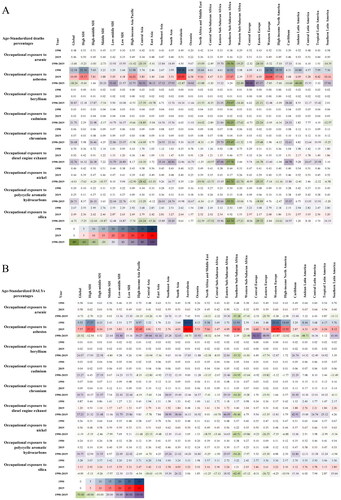
Figure 10. Age-standardized deaths and DALYs percentages of TBL cancer attributable to occupational carcinogens among global, 5 SDI quintiles and 21 GBD regions in 1990 and 2019 and their changes from 1990 to 2019. (A) Age-standardized deaths percentages; (B) Age-standardized DALYs percentages.
Supplemental Material
Download PDF (1.2 MB)Data availability statement
The datasets supporting the conclusions of this article are included within the article.