
Figures & data
Figure 1. PCA analysis of 1789 proteins quantified in all 15 CFS-only and 15 CFS + FM CSF samples. ANOVA analysis revealed a total of 14 proteins with p value <.05; however, none of these proteins has an adjusted p value <.05. There is no clear separation of the two groups using their entire CSF proteome profiles.
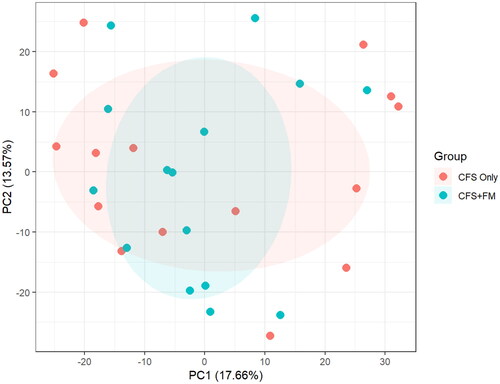
Figure 2. Random forest classifier cross-validation. A random forest machine learning approach was used to classify between the two groups based on relative protein abundance changes. Prediction accuracy was estimated using LOOCV. The selection frequency for the differential proteins being selected into the Random Forest classifiers for separating the two groups is shown in the left panel (only 4 of 29 proteins were selected in 50% of the models), and the AUC composed from all LOOCV predictions was 0.67 (right panel).
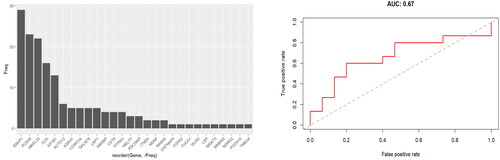
Figure 3. Unsupervised hierarchical clustering of the entire CSF proteome. There is no clear separation of the two groups using their entire CSF proteome profiles. The TMT-11 plex from which the individual samples were analysed is also shown as a reference.
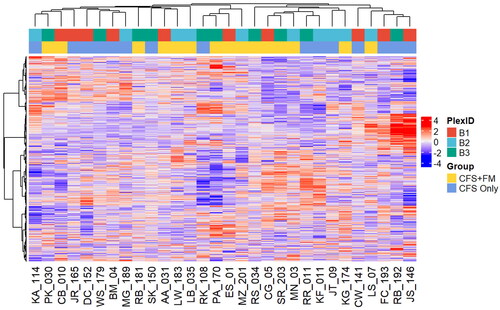
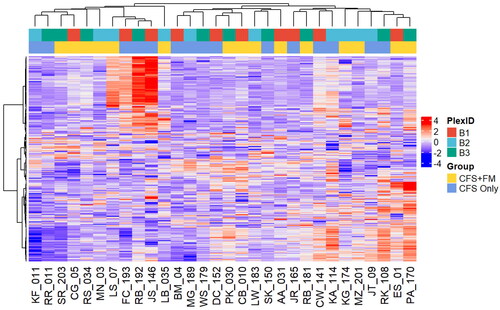
Figure 4. Unsupervised hierarchical clustering of the top 20% most variable CSF proteome. There is no clear separation of the two groups. The TMT-11 plex from which the individual samples were analysed is also shown as a reference.
Supplemental Material
Download PDF (27.6 KB)Supplemental Material
Download MS Excel (447.2 KB)Data availability statement
The raw MS data have been deposited to MassIVE (accession: MSV000090685) and PRIDE (accession: PXD038078). The access link is https://massive.ucsd.edu/ProteoSAFe/dataset.jsp?task=457b0ce78fdc460b9f36d59dcce15572. The username for web access: MSV000090685_reviewer, and the access key is CSF3429. A preprint precursor version of this study was published at BioRxiv: https://www.biorxiv.org/content/10.1101/2022.09.14.506792v2.