
Figures & data
Figure 1. Sex distribution of the participants (n = 255).
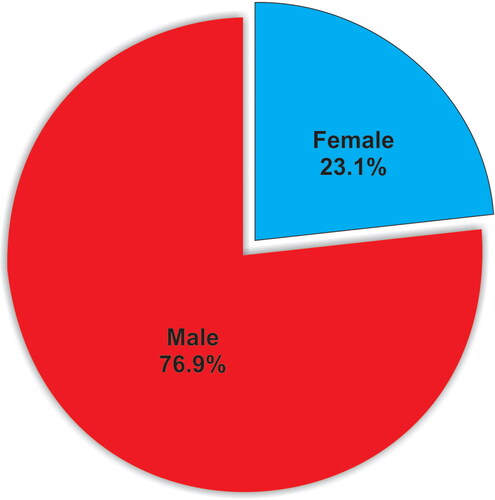
Figure 2. Participants’ expertise (n = 255).
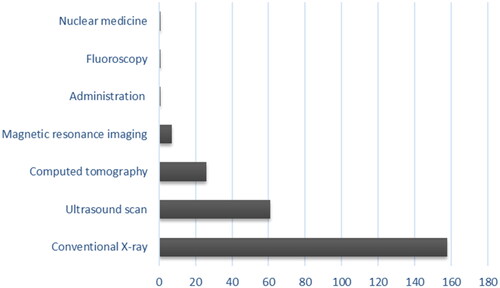
Table 1. Demographic characteristics of the survey participants (n = 255).
Table 2. Response percentage and median showing the attitude of the participants towards radiography practice during the COVID-19 pandemic (n = 255).
Table 3. Participants’ responses on COVID-19 symptoms, transmission and hospital infection (n = 255).
Figure 3. Participants’ sources of COVID-19 information (n = 255).
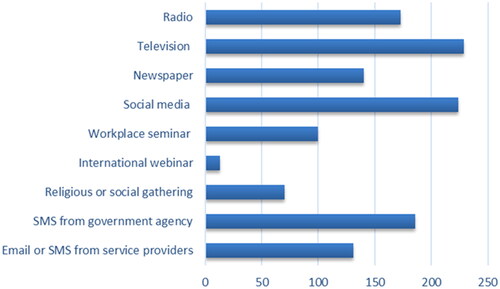
Table 4. ANOVA: differences in the knowledge of symptoms and preventive measures of COVID-19, attitude and safe practices across selected demographic variables.
Table 5. Correlations between knowledge of symptoms and preventive measures of COVID-19, attitude and safe practices (n = 255).
Data availability statement
The questionnaire used and datasets analysed during the current study are available from the corresponding author on reasonable request. Our institution’s ethics guidelines warrant that the primary investigator holds primary data for at least five years before making it publicly available.