
Figures & data
Figure 1. Flow chart of the literature search and study selection process.
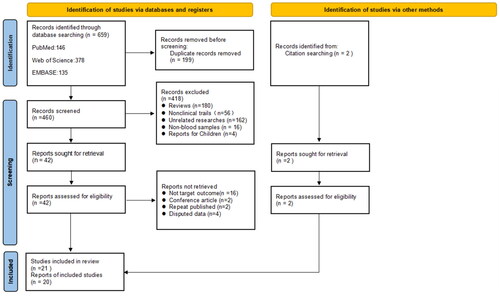
Table 1. Characteristics of the selected studies.
Figure 2. Meta-analysis of the association between circulating TMAO concentrations and all-cause mortality in non-dialysis patients and dialysis patients respectively. RR: relative risk; CI: confidence interval.
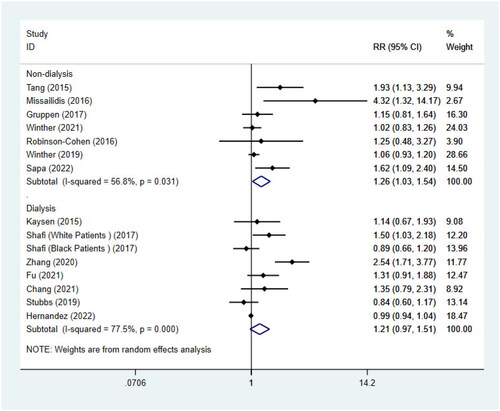
Table 2. Subgroup analysis of the association between circulating TMAO concentrations and all-cause mortality in non-dialysis CKD patients.
Table 3. Subgroup analysis of the association between circulating TMAO concentrations and all-cause mortality in dialysis patients.
Figure 3. Meta-analysis of the association between circulating TMAO concentrations and cardiovascular mortality in non-dialysis patients and dialysis patients respectively. HR: hazard risk; CI: confidence interval.
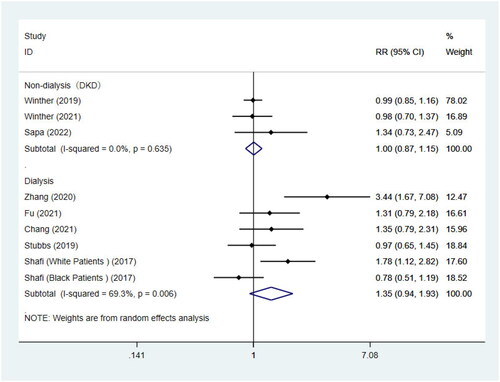
Table 4. Subgroup analysis of the association between circulating TMAO concentrations and cardiovascular mortality in dialysis patients.
Figure 4. Dose-response meta-analysis of the association between TMAO and all-cause mortality in non-dialysis patients.
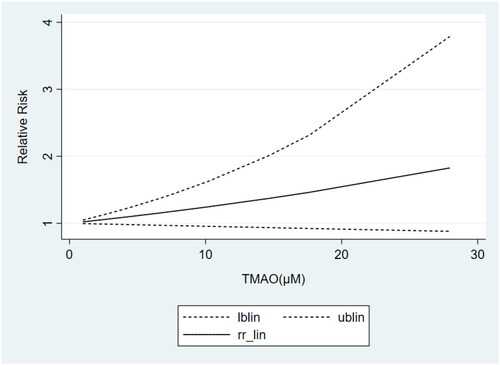
Figure 5. Dose-response meta-analysis of the association between TMAO and all-cause mortality in non-black dialysis patients.
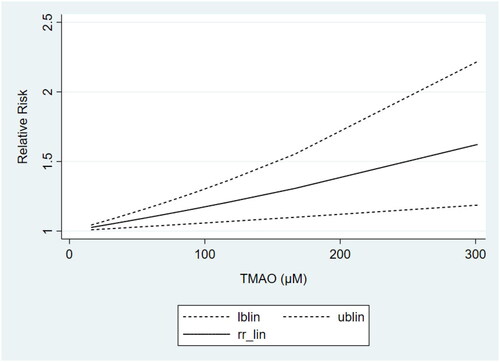
Figure 6. Dose-response meta-analysis of the association between TMAO and cardiovascular mortality in non-black dialysis patients.
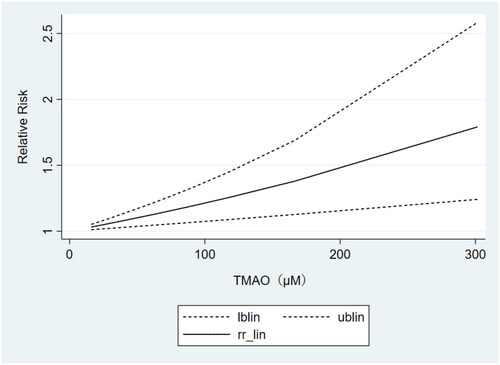
Figure 7. Meta-analysis of the correlations between circulating TMAO concentrations and GFR in non-dialysis CKD patients. r, coefficient of association; CI, confidence interval.
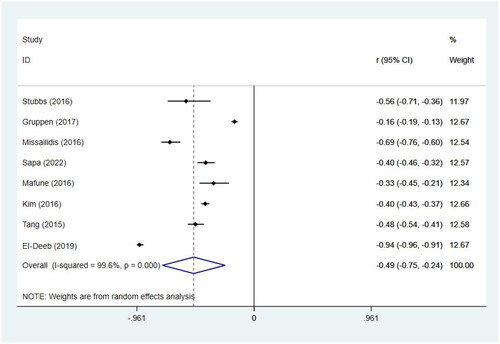
Table 5. Subgroup analysis of the correlations between circulating TMAO concentrations and GFR in non-dialysis CKD patients.
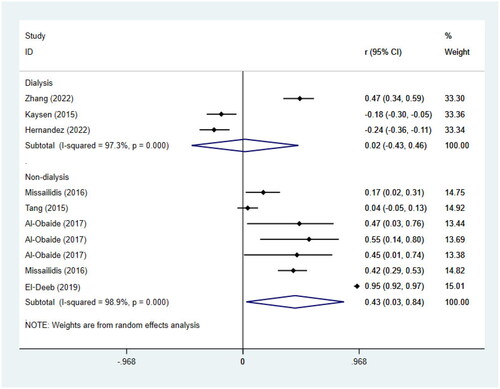
Figure 8. Meta-analysis of the correlations between circulating TMAO concentrations and inflammatory biomarkers in non-dialysis patients and dialysis patients respectively. r, coefficient of association; CI, confidence interval.
Supplemental Material
Download PDF (268.2 KB)Data availability statement
The raw data supporting the conclusions of this article will be made available by the authors, without undue reservation.