
Figures & data
Figure 1. Flow chart of inclusions and exclusions of the study participants. SBP: systolic blood pressure; DBP: diastolic blood pressure; TC: total cholesterol; HDL-C: high-density lipoprotein cholesterol; TG: triglycerides; FPG: fasting plasma glucose; 2-h PG: 2-hour post-challenge plasma glucose; Scr: serum creatinine; eGFR: estimated glomerular filtration rate.
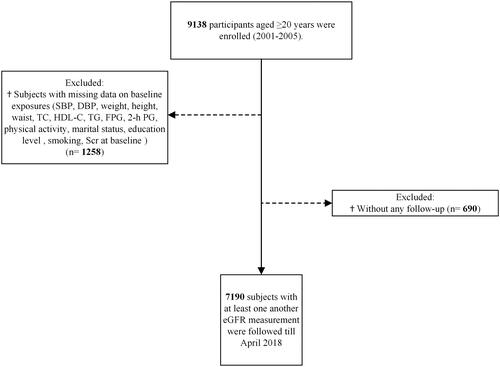
Table 1. Baseline characteristics of the study participants stratified by gender: Tehran Lipid and Glucose Study.
Figure 2. The sex-specific crude incidence rate of kidney function decline per 10,000 person-year, stratified by 10-year age group categories. Legend: Due to the small numbers of those aged ≥80 years, all subjects aged ≥70 years were categorized into one age group.
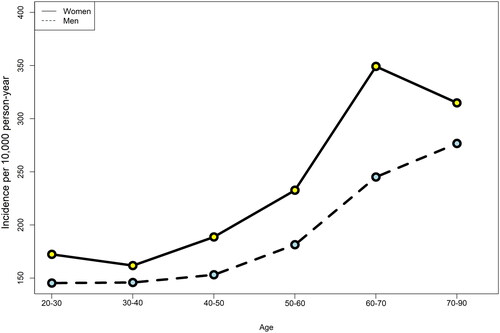
Table 2. Association of risk factors with decline in kidney function in the Tehran Lipid and Glucose Study.
Table 3. Sub-distribution Hazard ratios and 95% CI of risk factors for the decline in kidney function, stratified by baseline eGFR, in the Tehran Lipid and Glucose StudyTable Footnotea.
Table 4. Sub-distribution Hazard ratios and 95% CI of risk factors for the decline in kidney function, stratified by gender, in the Tehran Lipid and Glucose StudyTable Footnotea.
Table 5. Sub-distribution Hazard ratios and 95% CI of risk factors for the decline in kidney function, stratified by menopausal status among women, in the Tehran Lipid and Glucose StudyTable Footnotea.
Supplemental Material
Download MS Word (21.5 KB)Supplemental Material
Download MS Word (17.7 KB)Data availability statement
The data supporting this study’s findings are available from the corresponding author, F.H., upon reasonable request.