
Figures & data
Figure 1. Experimental technical roadmap.
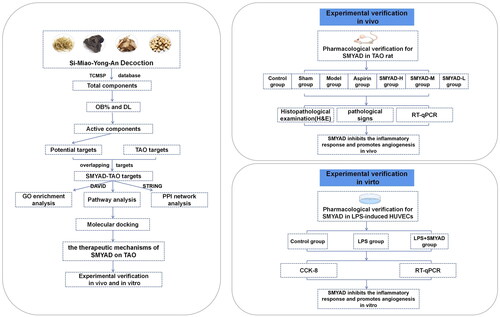
Table 1. The composition of SMYAD.
Figure 2. Functional enrichment analysis. (A) The Venn diagram of the potential targets in SMYAD and the therapeutic targets for TAO. (B) GP biological process enrichment analysis of 24 TAO treatment targets in SMYAD. (C) KEGG pathway enrichment analysis of 24 TAO treatment targets in SMYAD.
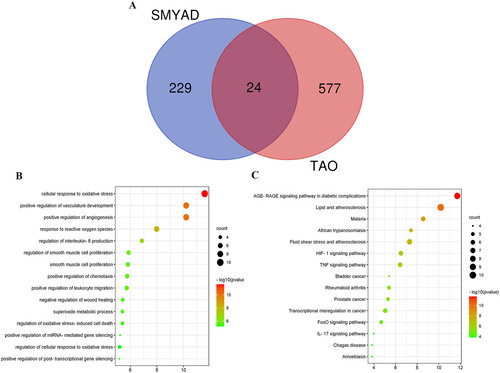
Figure 3. The herbs–compounds–targets interaction network.
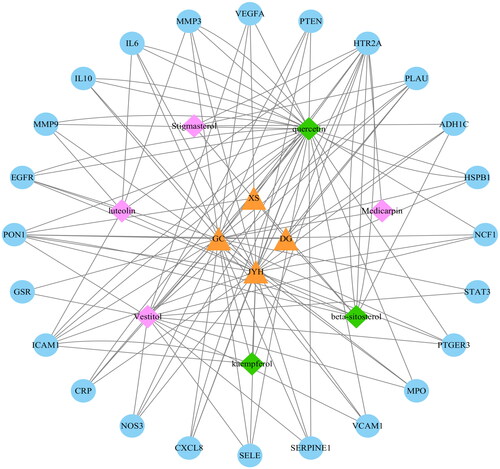
Figure 4. The pathways–phenotypes interaction network.
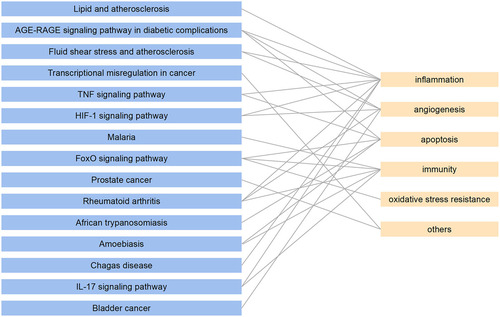
Figure 5. Protein–protein interaction network.
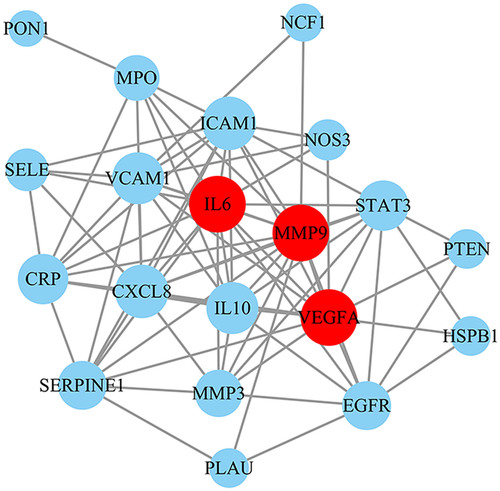
Figure 6. Molecular docking of TAO related targets with main compounds of SMYAD. (A) Vestitol binds to protein IL6. (B) Vestitol binds to protein MMP9. (C) Vestitol binds to protein VEGFA.
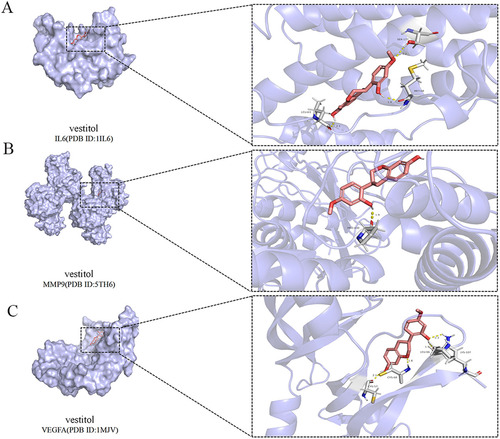
Table 2. The results of molecular docking.
Figure 7. Appearance of the left hind limbs of rats. Control: control group, sham: sham-operated group, aspirin: positive control group, TAO: TAO model group, SMYAD-L: SMYAD low-dose group, SMYAD-M: SMYAD medium-dose group and SMYAD-H: SMYAD high-dose group.
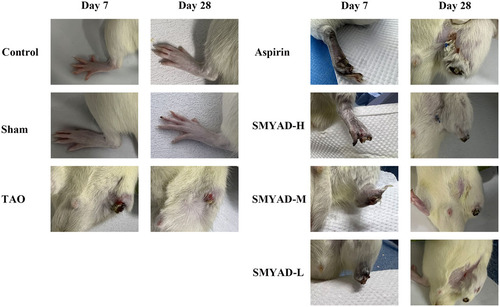
Figure 8. Pathological changes in the femoral arterial wall of all group, as observed using optical microscopy (H&E staining, ×200). (A) Control group, (B) sham group, (C) TAO model group, (D) aspirin group, (E) SMYAD-H group, (F) SMYAD-M group and (G) SMYAD-L group. Scale bar = 100 µm.
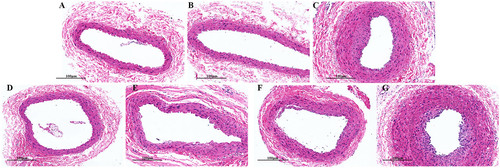
Figure 9. IL6, MMP9 and VEGFA expressions in the femoral artery wall. (A) IL6 expression. (B) MMP9 expression. (C) VEGFA expression. Data are expressed as mean ± SEM (n = 3 per group). ##p < .01 compared with the control group; **p < .05 compared with the TAO model group.
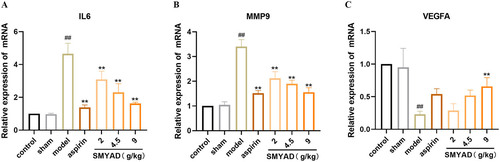
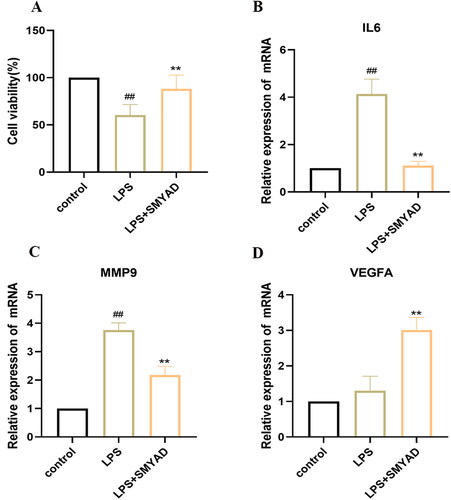
Figure 10. SMYAD effects on the cell viability and expression of IL6, MMP9 and VEGFA in LPS-induced HUVECs. (A) Cell viability; (B) IL6 expression; (C) MMP9 expression; (D) VEGFA expression.
Supplemental Material
Download MS Excel (69.5 KB)Data availability statement
On reasonable requests, the datasets used and/or analysed during the current investigation were available from the corresponding author.