
Figures & data
Table 1. Comparison of general conditions and biochemical indexes between the two groups.
Figure 1. Forest map of GBS risk factors of patients with T2DM.
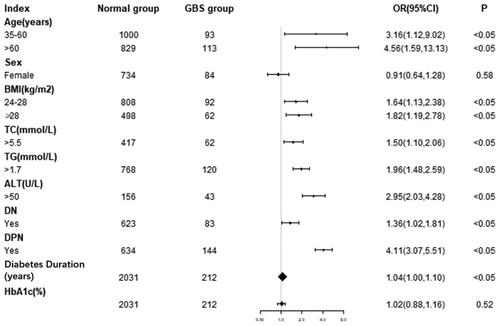
Figure 2. Nomogram for GBS in patients with T2DM. Instructions: Each individual’s GBS risk for patients with T2DM was estimated by plotting each variable axis. A verticle line was drawn from that value to the top points scale to determine the number of points assigned by that variable value. Then, the points from each variable value were summed. The sum on the total points scale was located and vertically projected onto the bottom axis, and then a personalized risk for GBS was obtained.
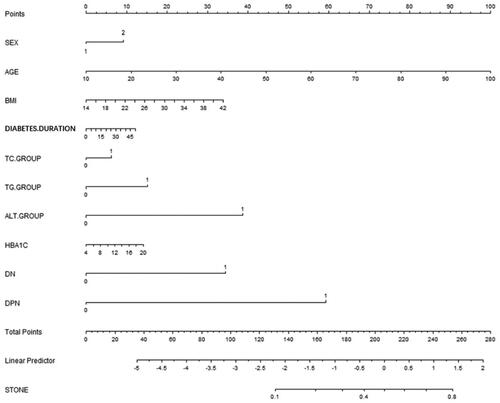
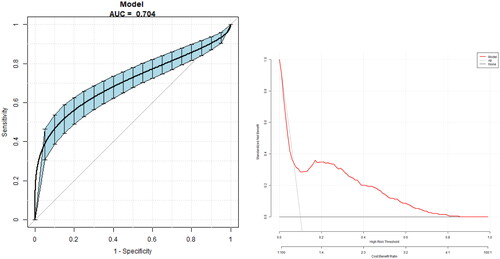
Figure 3. ROC curves for the accuracy of the GBS nomogram in patients with T2DM.The AUC of the nomogram for GBS was 0.704 (95% CI 0.656, 0.748), with a specificity of 90.34%, a sensitivity of 55.38%, and an accuracy of 86.83%, respectively.
Data availability
The datasets generated during the current study are available from the corresponding author upon reasonable request.