
Figures & data
Figure 1. The CONSORT flow diagram. 30 patients were assessed and 1 was excluded because of developing secondary MDS from AA. Twenty-nine eligible patients were enrolled and allocated to receive AVA, as the intention-to-treat group. Four patients were treated with AVA for less than two months, either due to loss of follow-up (n = 3) or withdrawal of consent (n = 1). Twenty-five patients were included in the efficacy analysis.
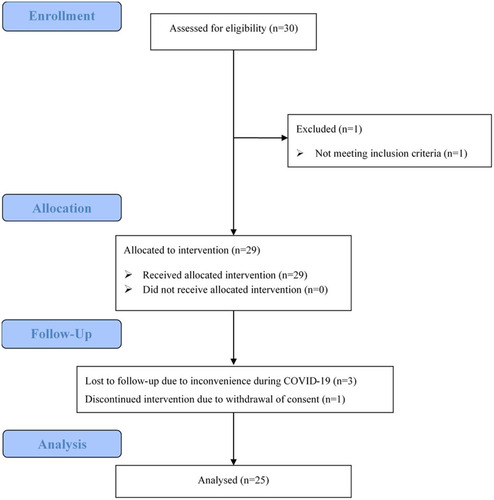
Table 1. Baseline characteristics of the intent-to-treat (n = 29) and the evaluable patients (n = 25).
Figure 2. Venn diagrams presenting the number of patients with the response for one or more lineages at 3 months (left) and last follow-up (right) at 3 months, 7 patients showed improvement in one lineage, 3 in two lineages, and 4 in three lineages. At a median of 7 (3–10) months follow-up, 11 patients showed a platelet response; 9 showed a haemoglobin response, and 7 showed a neutrophil response.
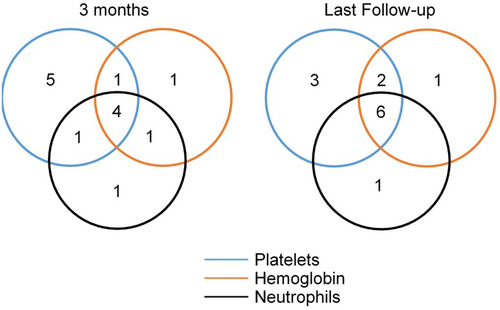
Figure 3. The longitudinal measurement of platelet (PLT, A), haemoglobin (HGB, B), and neutrophil (NEU, C) in responders. At 3 months, 44% (11/25) patients showed platelet response, 37% (7/19) showed haemoglobin response, and 54% (7/13) showed neutrophil response. At 6 months, 58% (7/12) patients showed platelet response, 55% (6/11) showed haemoglobin response, and 83% (5/6) showed neutrophil response. At the last follow-up, 44% (11/25) of patients showed platelet response. 47% (9/19) of patients showed haemoglobin response. 54% (7/13) of patients showed a neutrophil response. One patient who achieved PR after 2-months of AVA treatment and maintenance for 1 month (, patient no. 19) relapsed after 1 month of stopping AVA.
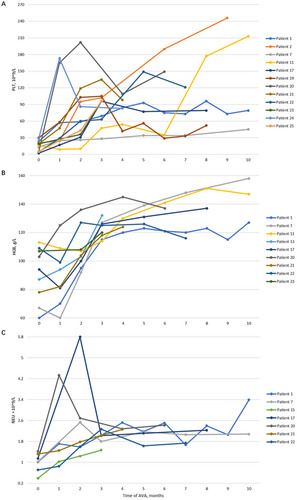
Table 2. Comparisons of baseline characteristics between responders and non-responders.
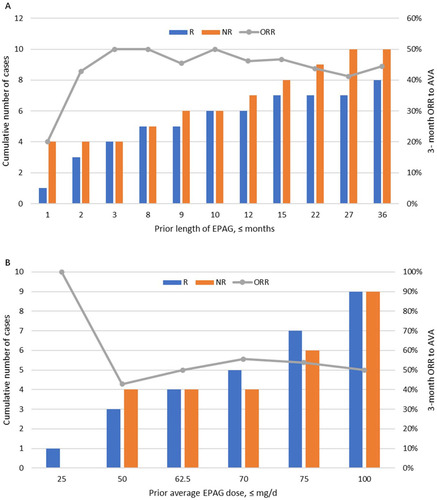
Figure 4. Relationship between prior eltrombopag (EPAG) and 3-month overall response rate (ORR) to avatrombopag (AVA). 18 (72%) of the 25 patients were previously treated with EPAG for 8 (1–36) months at 72.5 (25–100) mg/d dosage; 44% (8/18) responded to AVA at 3 months. (A) Prior length of using EPAG showed no significant linear relationship with the 3-month ORR of AVA (R2=0.11). (B) There is no significant correlation between the previous cumulative EPAG dose and the 3-month ORR for AVA (R2=0.30).
Supplemental Material
Download MS Excel (17 KB)Data availability statement
Data are included in Supplementary files. The full study protocol can be obtained upon a reasonable request to the corresponding author.