
Figures & data
Figure 1. Distribution of daily costs of psychotropic drugs. The X axis shows the daily costs of psychotropic drugs, ranked by every JPY100 (USD1 in 2016). The Y axis shows the number of patients. The total number of patients was 3130; 800 patients were 25.6% of total, 600 patients were 19.2%, 400 patients were 12.8%, and 200 patients were 6.4%. The daily costs of psychotropic drugs ranged JPY0-JPY3245 (mean, 349, median 201–300, mode 1–100). The distribution was exponential. Seventy-four percent of the patients were treated with five drugs or less.
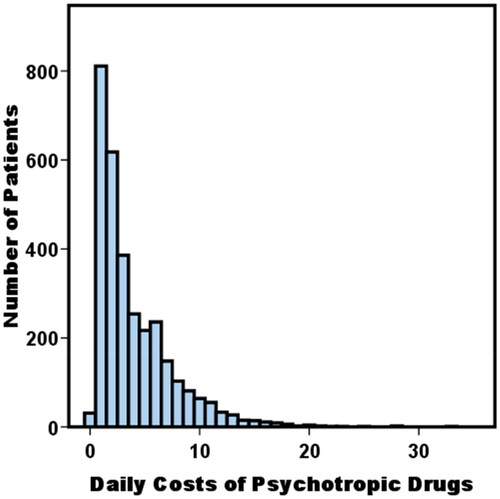
Table 1. Relationship between clinical features and daily cost of psychotropic drugs.
Table 2. Variables associated with costs of psychotropics in the outpatients clinics.
Supplemental Material
Download MS Word (15.5 KB)Data availability statement
Anonymized data not published within this article will be made available by request from any qualified investigators if approved by our institutional ethical committees.