
Figures & data
Figure 1. Procedure of data collection.
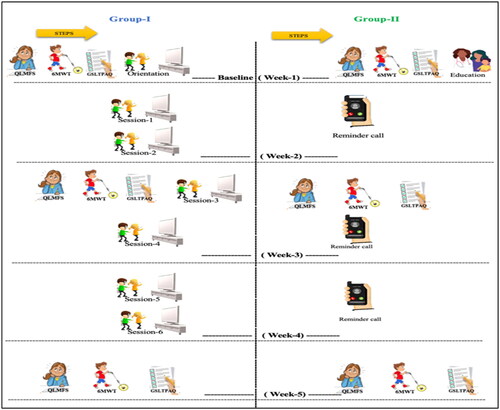
Table 1. Demographic and clinical characteristics.
Table 2. Comparison between groups at baseline.
Table 3. Between – Within subjects’ ANOVA, on CRF, functional capacity/endurance, and PA (n = 45).
Table 4. The results of post-hoc comparisons using the Bonferroni test for CRF and functional capacity/endurance over the 3 periods (T1, T2, and T3) within the groups.
Data availability statement
The data supporting this study’s findings are available on request from the corresponding author [A.S]. The data are not publicly available due to their containing information that could compromise the privacy of research participants.