
Figures & data
Figure 1. Study flow chart. MEP: motor-evoked potential; ICU: intensive care unit.
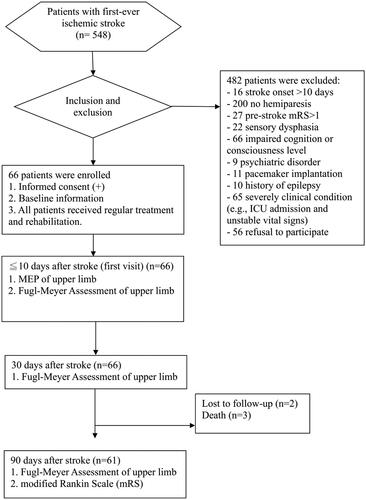
Table 1. Clinical characteristics of all patients with stroke.
Figure 2. Fugl-Meyer Assessment (FMA) score and proportional recovery over time in the two groups. T1: ≤10 day after stroke, T2: 30-day after stroke, T3: 90-day after stroke. *p < 0.05, **p < 0.001
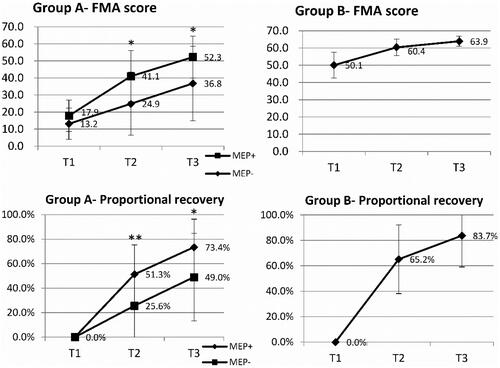
Table 2. Clinical characteristics of patients with stroke with an initial FMA score of ≤38 (group A) or >38 (group B).
Table 3. Motor recovery after a stroke at different time points.
Table 4. Comparison of FMA score and proportional recovery at different time points between MEP + and MEP- patients in group A.
Table 5. Analysis of good functional outcome (mRS ≤1) at 90-day after stroke.
Supplemental Material
Download MS Word (19.6 KB)Data availability statement
The data that support the findings of this study are available from the corresponding author, Dr. Ching-Huang Lin, upon reasonable request.