
Figures & data
Figure 1. Consort chart.
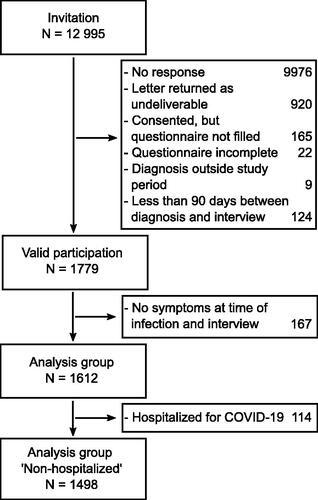
Table 1. Descriptive analysis of the main variables used in the study.
Table 2. Sample composition stratified by age and sex in comparison to all confirmed cases of SARSCoV-2 officially registered by RKI [Citation12] in the City of Bremen (Germany) between March, 1st, 2020 and January, 31st, 2021.
Figure 2. Symptoms reported at the time of infection (dark gray) and the time of interview (light gray) for females (hatching) and males (no hatching).
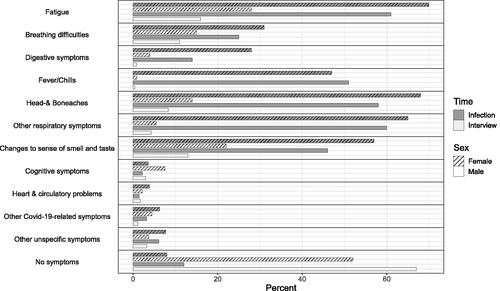
Figure 3. Percentage of symptoms reported at time of infection that were still persistent at time of the interview (dark gray) and percentage of symptoms that were newly reported at the time of interview (light gray).
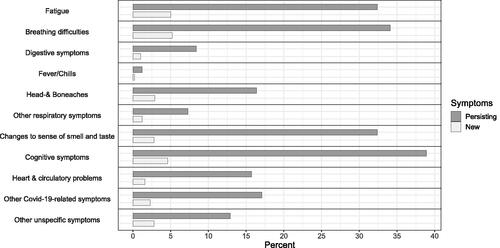
Table 3. Odds ratios (95% CIs) for reporting a post-COVID-19 for the analysis group (N = 1,612) condition estimated from a multivariable logistic regression model.
Supplemental Material
Download PDF (3.1 MB)Data availability statement
Datasets used in this study are available from the corresponding author (SR) upon reasonable request.