
Figures & data
Table 1. The baseline characteristics of the control, LT4 and GD groups.
Figure 1. The DPP4 concentration (a)/activity (B) of the control, LT4 and GD groups. LT4: levothyroxine; GD: Graves’ disease; NS: no significance.
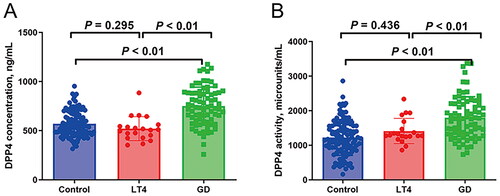
Table 2. Correlation analysis between serum concentration/activity of DPP4 and clinical parameters in the GD patients.
Table 3. Multivariate linear regression for the association of serum DPP4 concentration with thyroid function and TRAb in the GD group.
Table 4. Multivariate linear regression for the association of DPP4 activity with thyroid function and TRAb in the GD group.
Supplemental material
Supplemental Material
Download MS Word (15.7 KB)Data availability statement
All data of this study are available from the corresponding author Jia Liu for reasonable request.